Chapter 2 Data
There are three main types of data available for soccer analytics. The first type is similar to box score data, which provides the match outcome and statistics about each team’s performance, such as the number of shots and corner kicks taken. Our analysis utilizes event data, which describes the events that occur during a match and provide the 2D coordinates of the ball at the start and end of these events. The third and most granular type is tracking data, which generally records the 2D position of all players on the pitch and the 3D position of the ball throughout the match.
We utilize data collected by Wyscout, a leading soccer analytics platform. The data includes the 1,826 regular-season games played during the 2017-2018 season in five prominent European soccer leagues, including the English first division (EPL), the French first division (Ligue 1), the German first division (Bundesliga), the Italian first division (Serie A) and the Spanish first division (La Liga). Overall, this amounts to 3,071,396 unique events, for an average of 1,682 events per game.
For each of the five leagues, the events data details all the events that occur during the course of each match. The data includes a number of variables that describe the event, including its name, time at which it occurs and its starting and ending coordinates. All the event and sub-event names can be found in Appendix Table 6.1. It also includes variables that identify the player, team, match, and match period (1st or 2nd half) that the event corresponds to; the player, team and match IDs are unique numerical values assigned by Wyscout. Both the x and y coordinates are always in the range [0, 100] and indicate the percentage of the pitch from the perspective of the attacking team, which is assumed to always play from the left side to the right side of the pitch (Pappalardo, 2019). The value of the x coordinate indicates the event’s nearness (in percentage) to the opponent’s goal, while the value of the y coordinate indicates the event’s nearness (in percentage) to the right side of the field. For consecutive events in which the ball stays in play and is possessed by the same team, the ending coordinates of an event will match the subsequent event’s starting coordinates.
| Match ID | Team Name | Event Name | Timestamp | \((x,y)_{start}\) | \((x,y)_{end}\) |
|---|---|---|---|---|---|
| 2499719 | Arsenal | Pass | 810.4485 | (79.8, 15.4) | (74.55, 29.4) |
| 2499719 | Arsenal | Pass | 811.5564 | (74.55, 29.4) | (77.7, 34.3) |
| 2499719 | Arsenal | Duel | 813.9146 | (77.7, 34.3) | (78.75, 49) |
| 2499719 | Leicester City | Duel | 814.0040 | (27.3, 35.7) | (26.25, 21) |
| 2499719 | Arsenal | Shot | 815.4620 | (78.75, 49) | (105, 39.4) |
Table 2.1 shows an example of five events in our data. This play consists of two consecutive passes, a duel on the ball, and ends with a shot taken by Arsenal.
Wyscout’s data collection is performed by expert analysts that tag the events from match videos (Pappalardo, 2019). For each ball touch in the match, the analyst will add the event type, timestamp, and coordinates on the pitch. A series of quality control checks are performed, algorithmically and manually. Though these steps substantially reduce the margin of error, there is still potential for uncatchable mistakes.
The teams data describes the clubs that play in the five leagues during the 2017-2018 season. This dataset contains the name of the club (e.g. Liverpool) and a team ID, which can be matched with the team-identifying variable in the events dataset.
2.1 Processing the Data
The events and teams datasets, which are originally provided in JSON format, were transformed into data frames. We then merged the datasets by team ID so we also know the name of the club corresponding to each event.
Before conducting our analysis, we made three substantial changes to the merged dataset’s coordinates and coordinate system. Although soccer pitch measurements are not standardized, the preferred size for most professional clubs is 105 by 68 meters; we opted to make our pitch dimensions 105 by 70 meters for ease of calculations. Thus, the rescaled x coordinates are now always in the range [0, 105] and the y coordinates are now always in the range [0, 70]. From this point onward, references to the coordinates will be in terms of the rescaled pitch size.
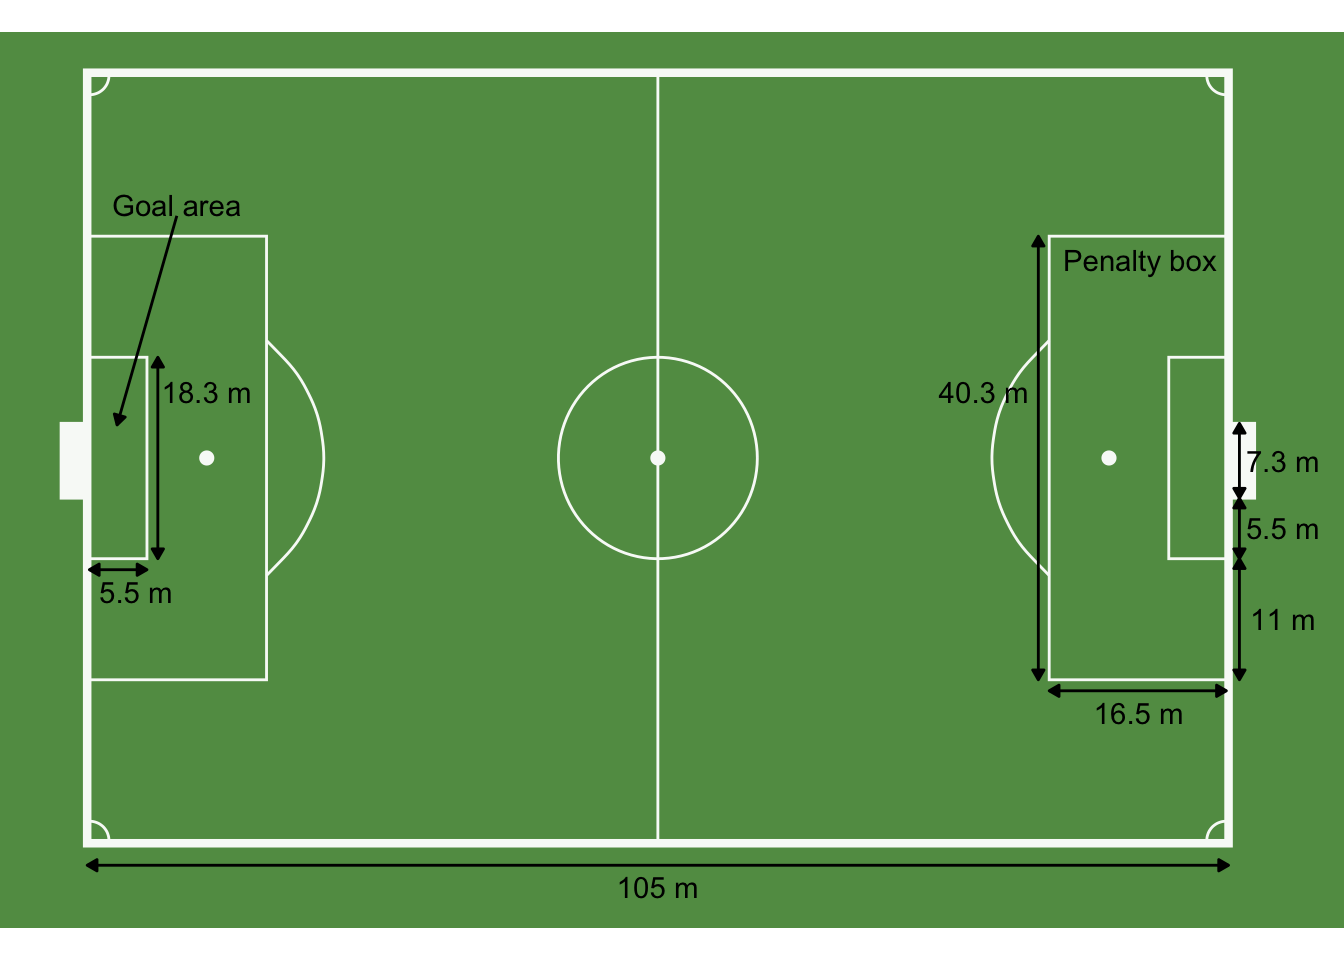
Figure 2.1: Standard pitch measurements. All units are in meters.
There were also inconsistencies with some of the coordinates, particularly with goal kicks and shots. The starting coordinates for goal kicks were initially recorded at either (0, 70) for the home team or (105, 0) for the away team. Neither of these coordinates is possible - goal kicks should start within the attacking team’s goal area, a 5.5 by 18.3 meter box centered at the goal-line. Thus, a goal kick’s starting x coordinate was changed to 0, and its starting y coordinate was sampled uniformly from the interval [25.85, 44.15], the y coordinates of the goal area.
The ending coordinates for shots are initially recorded at either (0, 70) for the home team or (105, 0) for the away team. Once again, neither of these coordinates is realistic. Since the ending coordinates of the shot should match the starting coordinates of the following event, we assigned all starting y coordinates of the following event that are not 0 or 70 as the ending y coordinate of the shot, and changed the ending x coordinate of the shot to the starting x coordinate of the following event. This readjustment accounts for shots that are off-target or blocked by another player, but the ball still remains in play. The ending x coordinates for all remaining shots were changed to 105, since these shots are either saved by the goalkeeper or deflected out of bounds. For these shots, the starting y coordinate of the following event is either 0 or 70. If the shot is saved by the goalkeeper, we assume that the shot was on-target. Thus, the ending y coordinates for saved shots were sampled uniformly from the interval [31.35, 38.65], the y coordinates of the goal. If the shot went out of bounds, we assume that the shot was off-target. Thus, the ending y coordinate was sampled uniformly from outside the y coordinates of the goal but within that of the penalty box, or uniformly from the interval [14.85, 31.35] \(\cup\) [38.65, 55.15].
Processing the JSON files and transforming the coordinates can be implemented with functions in the scoutr R package, a complete and consistent set of functions for reading, manipulating, and visualizing Wyscout soccer data.