Chapter 6 Appendix
Event Names
| Event Name | Sub Event Name | Event Name | Sub Event Name |
|---|---|---|---|
| Duel | Air duel | Free Kick | Throw in |
| Ground attacking duel | Goalkeeper leaving line | Goalkeeper leaving line | |
| Ground defending duel | Interruption | Ball out of the field | |
| Ground loose ball duel | Whistle | ||
| Foul | Foul | Offside | |
| Hand foul | Others on the ball | Acceleration | |
| Late card foul | Clearance | ||
| Out of game foul | Touch | ||
| Protest | Pass | Cross | |
| Simulation | Hand pass | ||
| Time lost foul | Head pass | ||
| Violent Foul | High pass | ||
| Free Kick | Corner | Launch | |
| Free Kick | Simple pass | ||
| Free kick cross | Smart pass | ||
| Free kick shot | Save attempt | Reflexes | |
| Goal kick | Save attempt | ||
| Penalty | Shot | Shot |
Minimum Number of Events per Possession
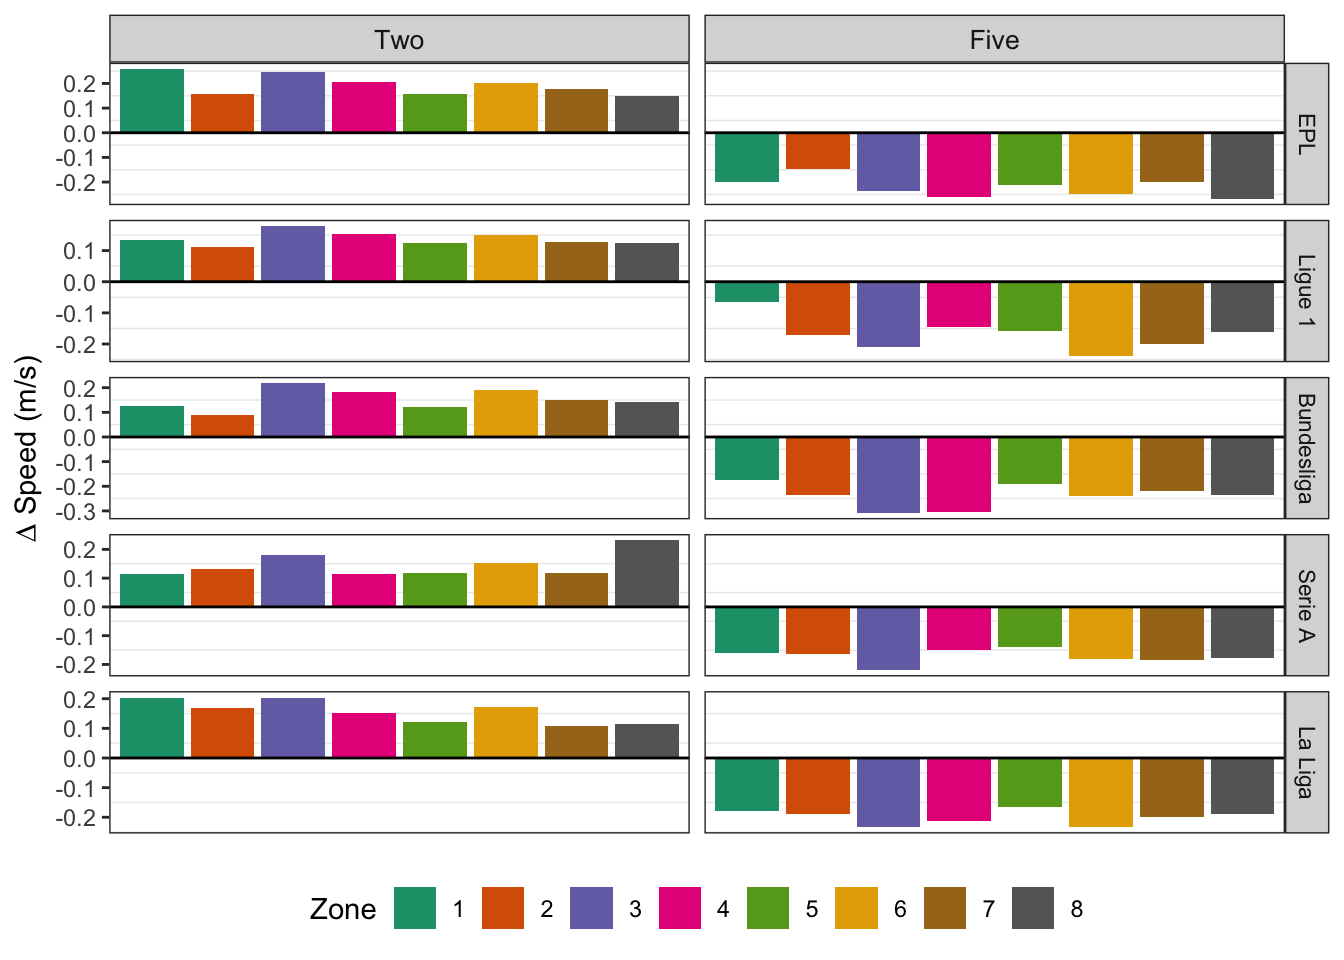
Figure 6.1: Difference in toal velocity across the five leagues when filtering for possessions with at least two and at least five events compared to that of possessions with at least three events. Note that there is no significant difference in total velocity among these three choices.
Average Distance per Pass
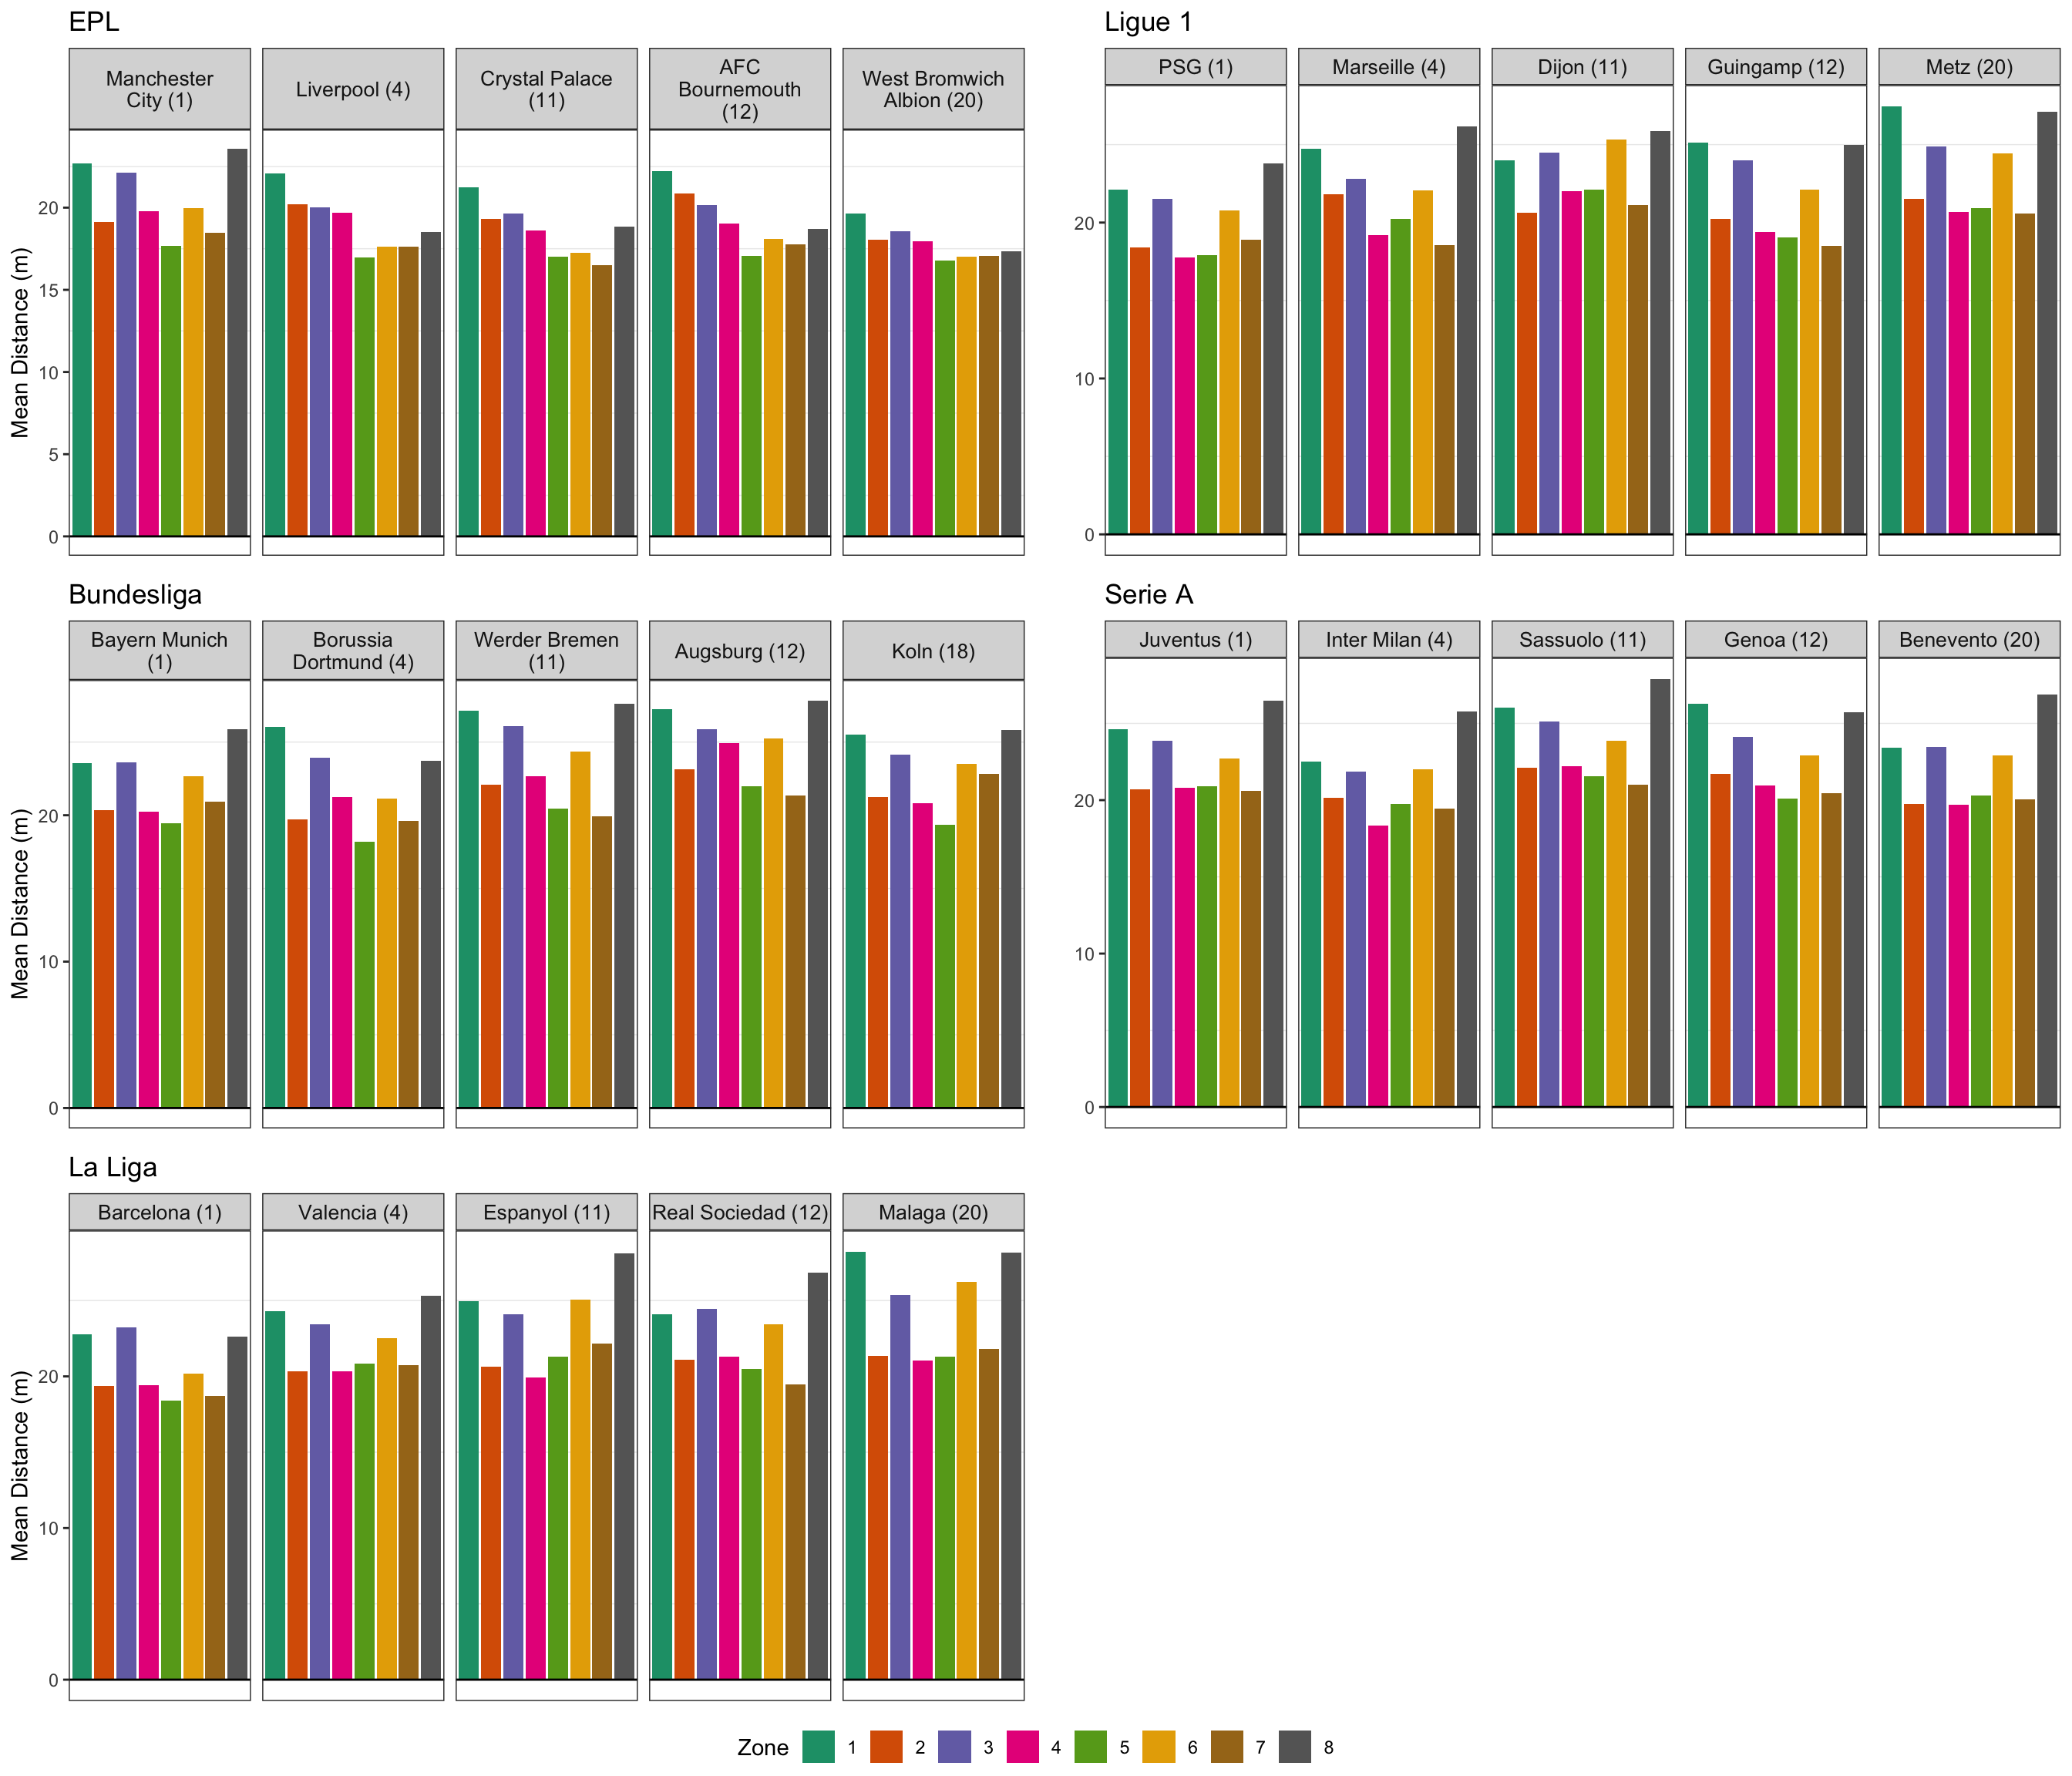
Figure 6.2: Average distance per pass for 5 teams in each league. Note that the average distance generally increases with decreasing team quality, except for in the EPL.
EPL Team-level Pace (Polygrid)
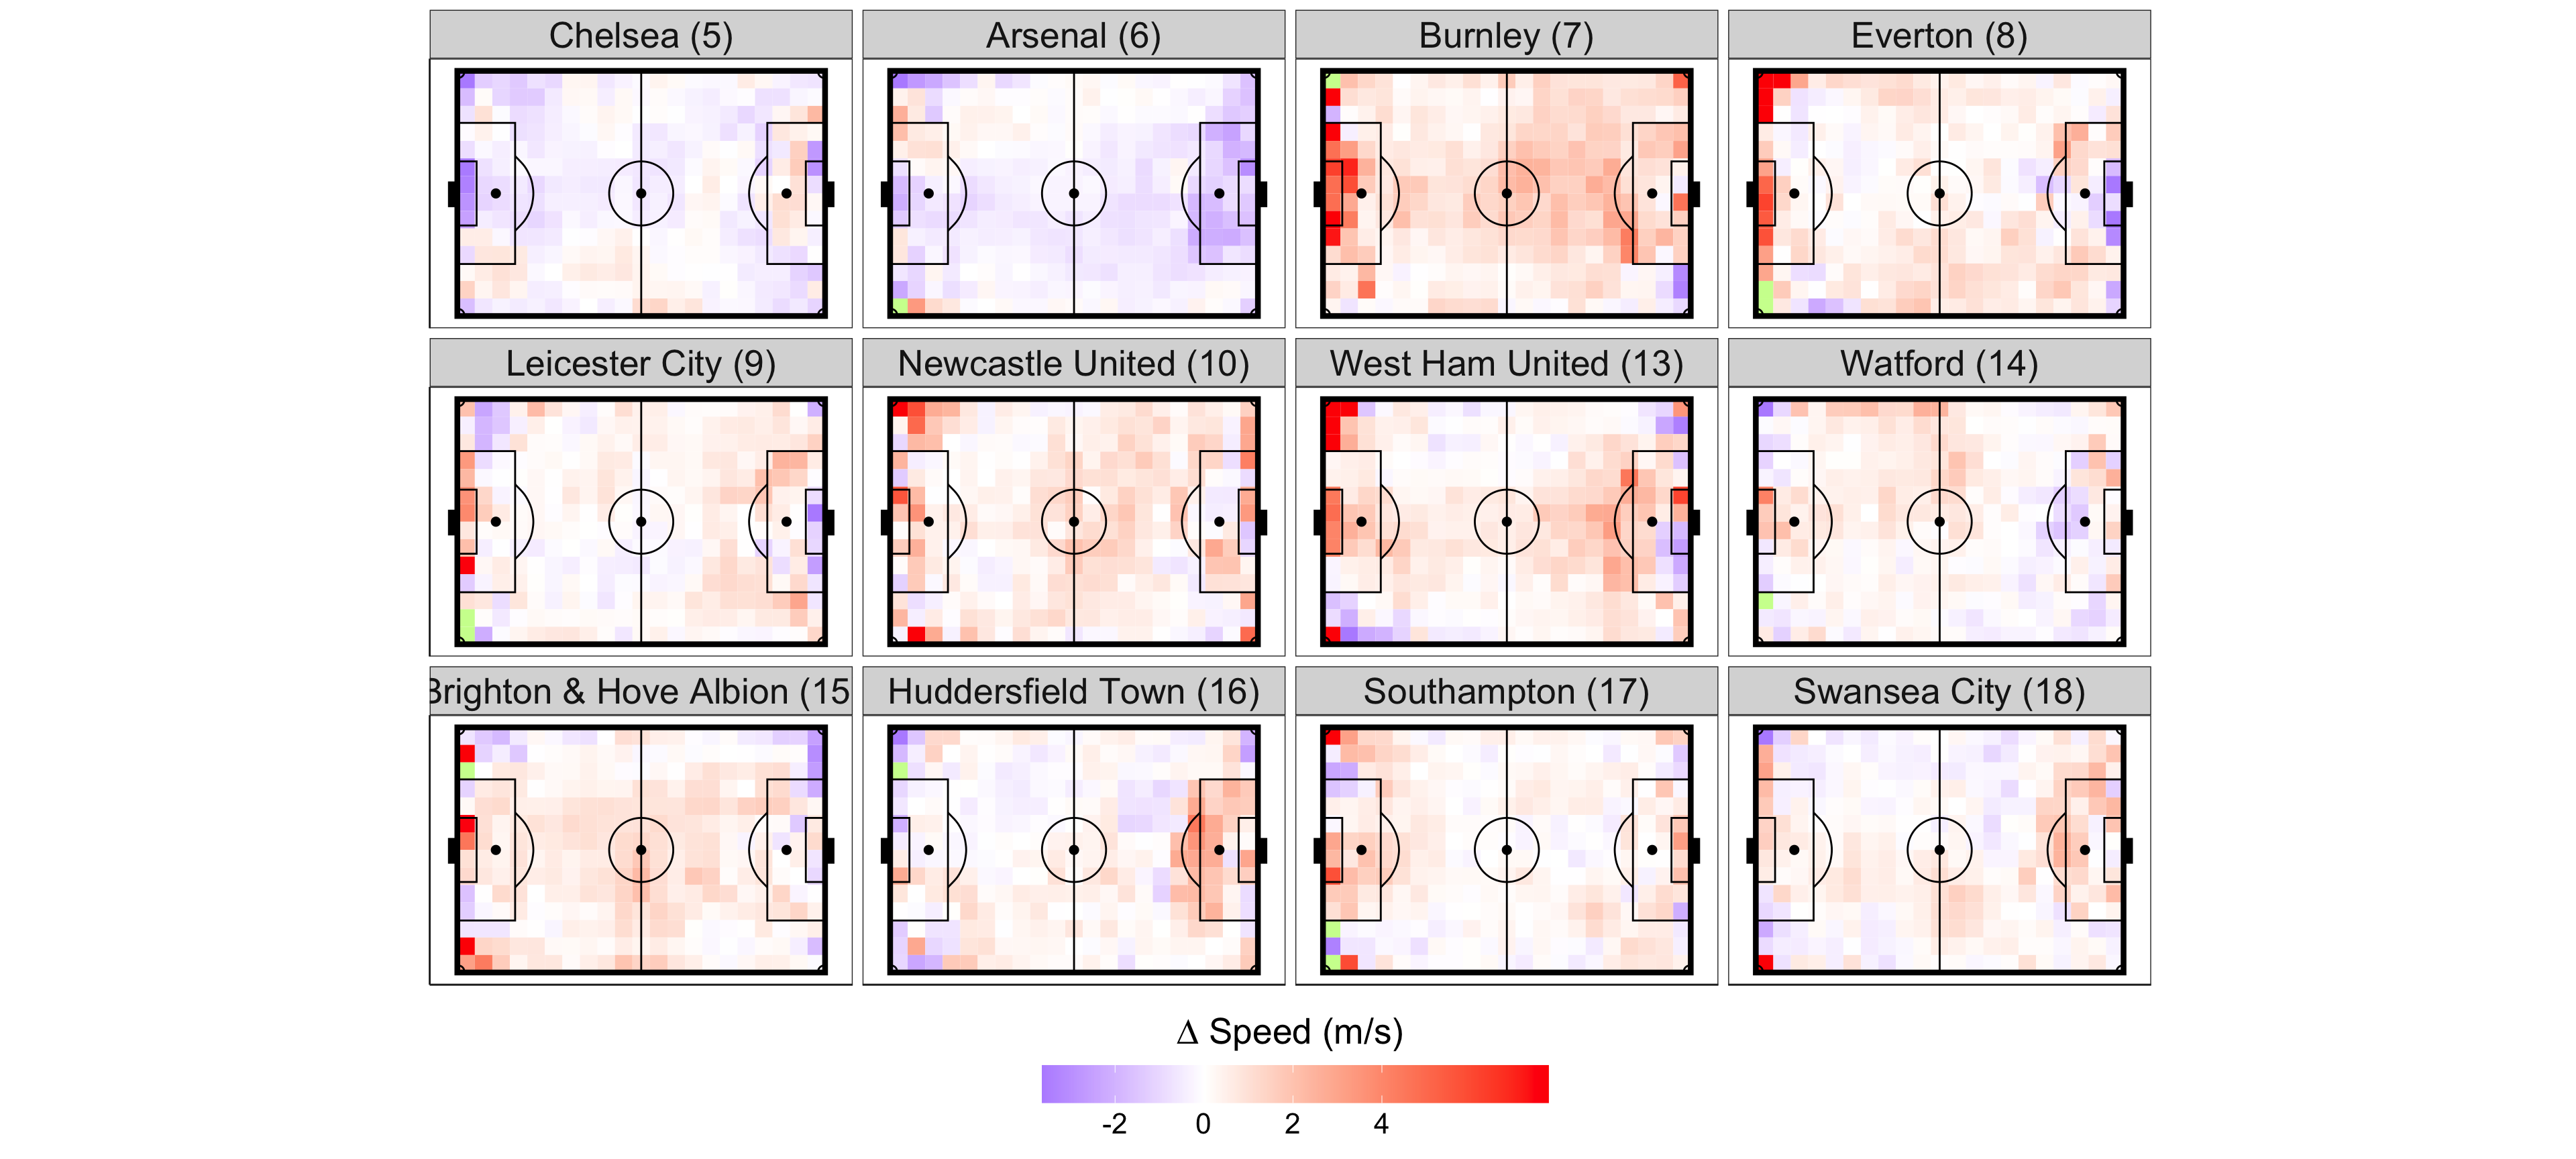
Figure 6.3: Polygrid analysis of total velocity by team vs. EPL average while attacking. Teams are ordered by final standings from the 2017-18 season. All units are in m/s.
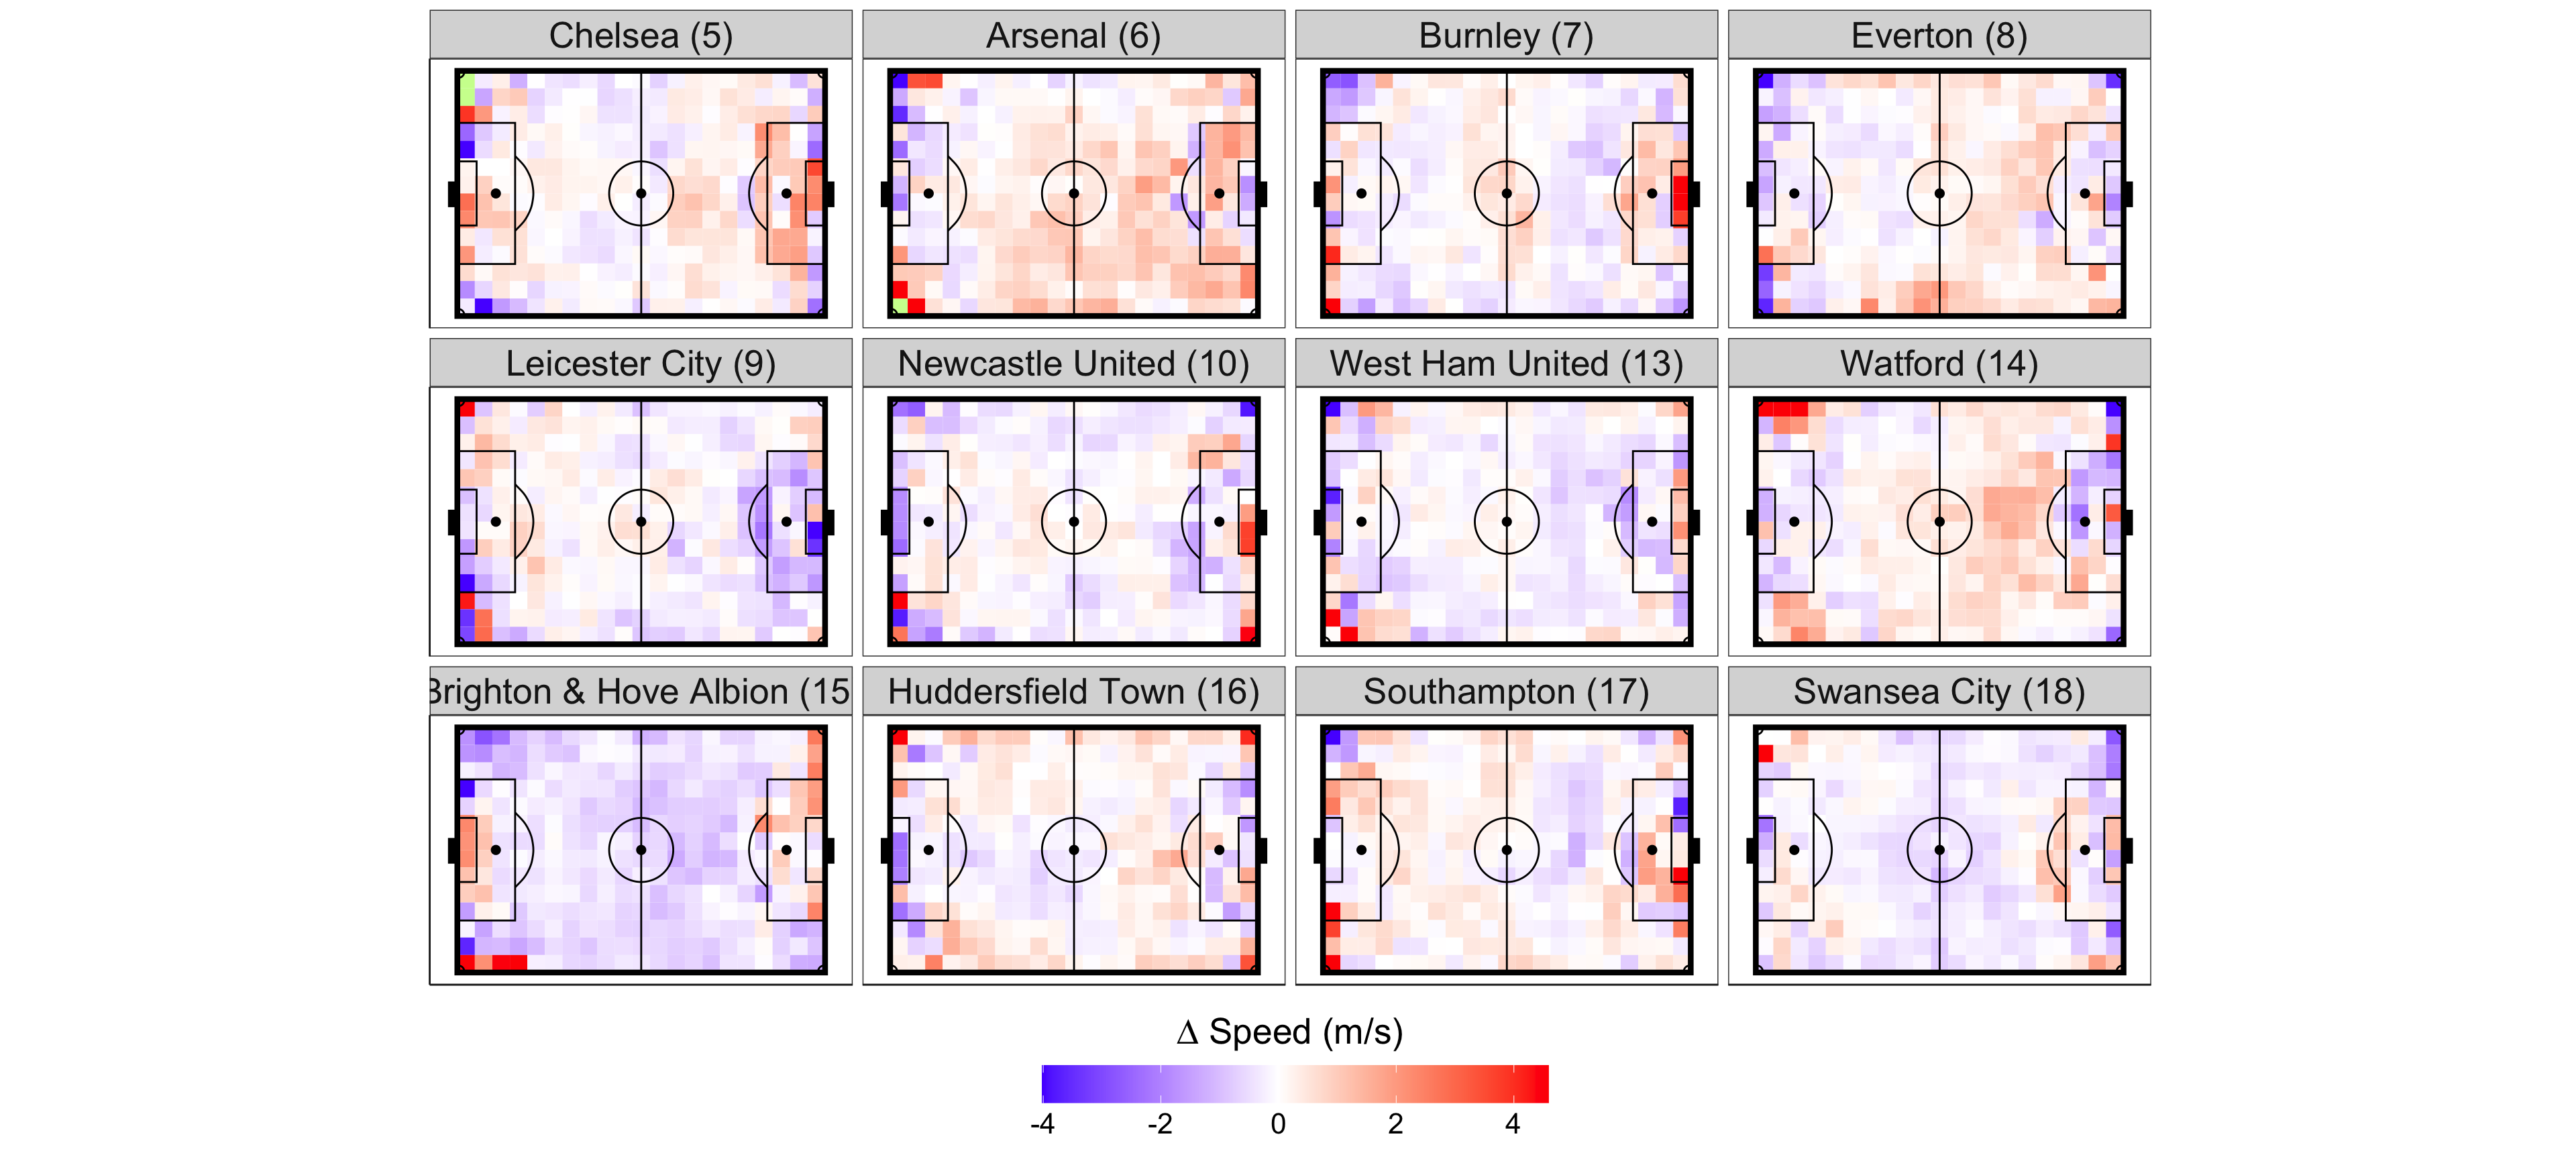
Figure 6.4: Polygrid analysis of total velocity by team vs. EPL average while defending. Teams are ordered by final standings from the 2017-18 season. All units are in m/s.
Hierarchical Logistic Model Diagnostics
| Model | Mean Accuracy | Mean AUC | Accuracy | AUC |
|---|---|---|---|---|
| Baseline | 58.29% | 56.53 | 63.52% | 60.57 |
| \(\Delta_{ij}^{AZ}\) | 58.06% | 56.32 | 65.56% | 62.80 |
| \(\Delta_{ij}^{OZ}\) | 59.7% | 58.27 | 63.78% | 61.16 |
| \(\Delta_{ij}^{FZ}\) | 59.91% | 58.52 | 64.29% | 61.68 |
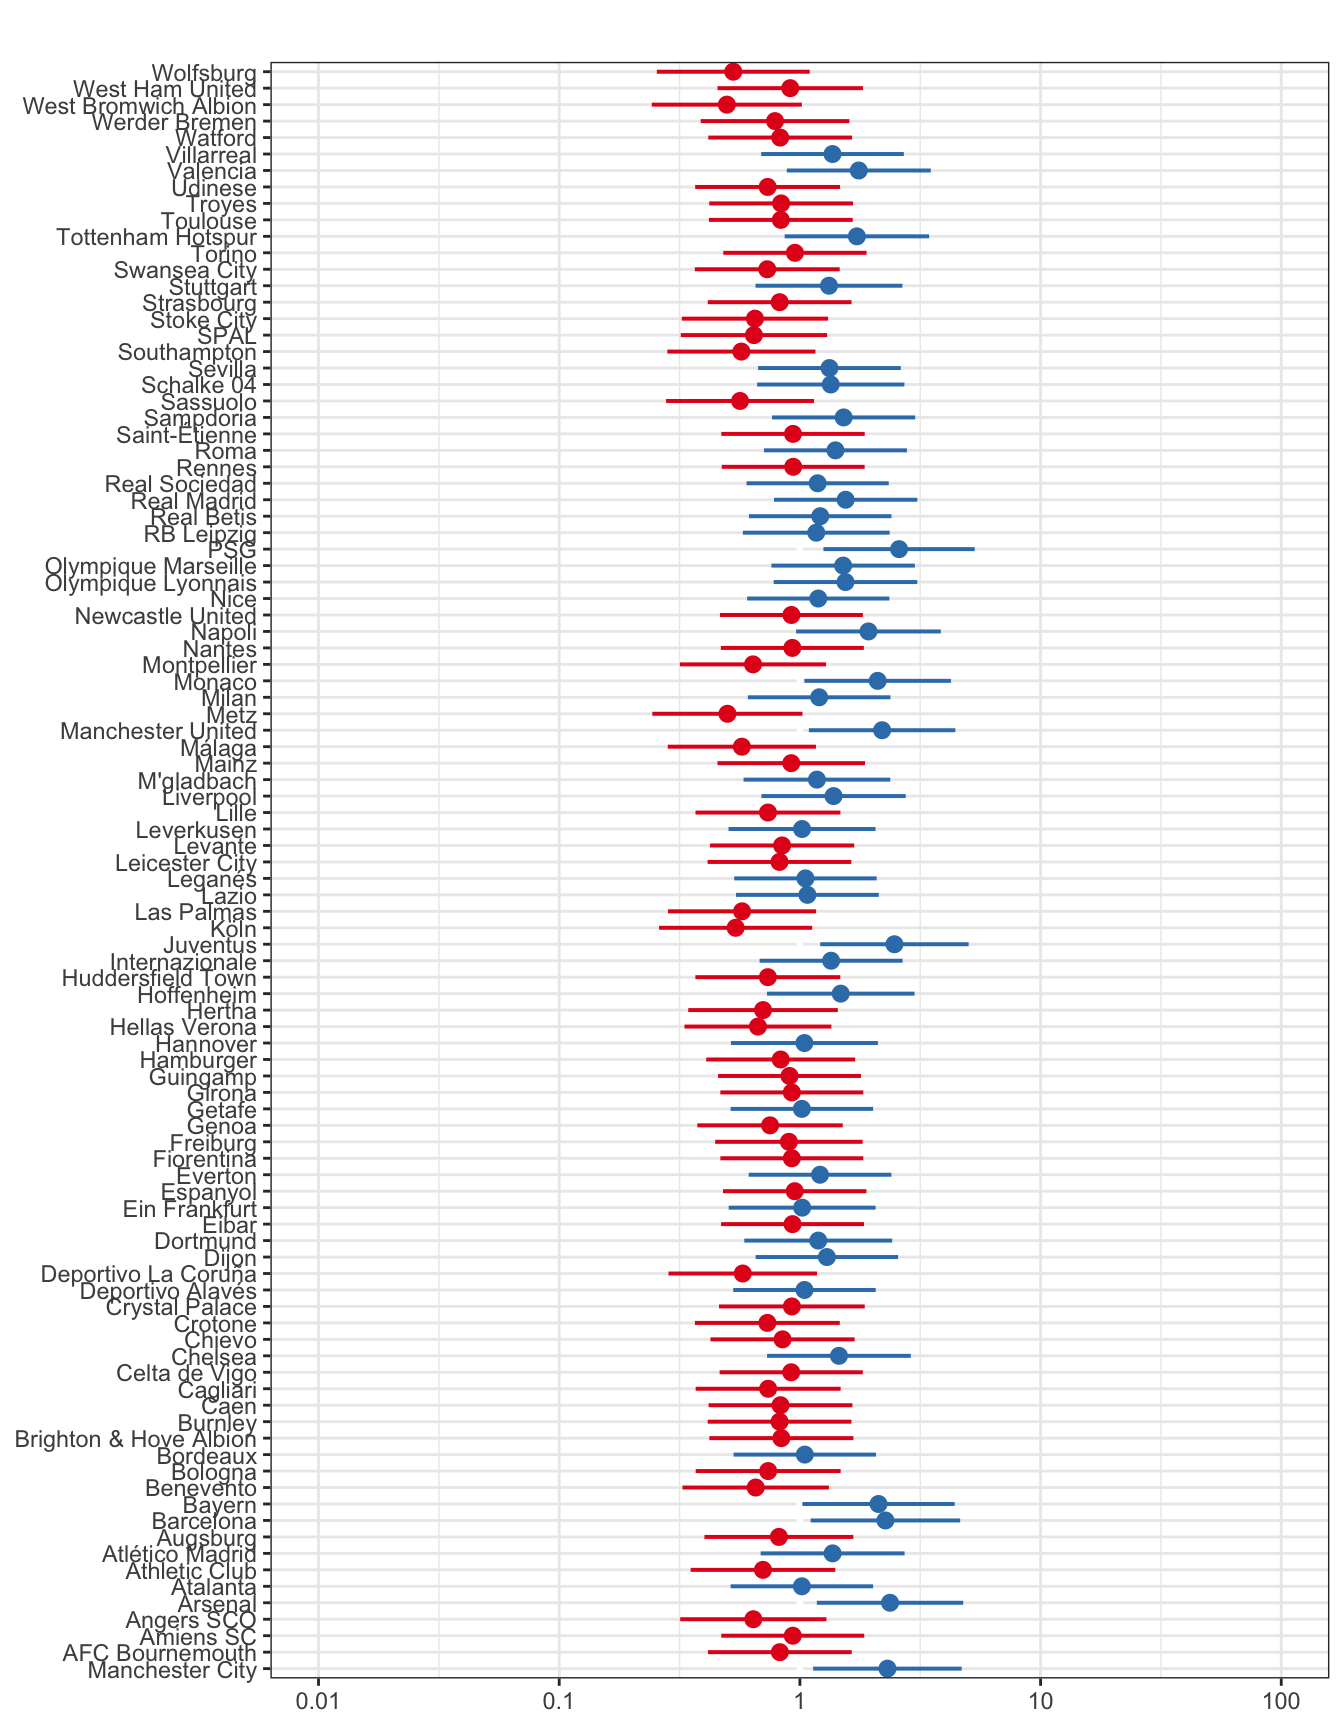
Figure 6.5: Random effects for Home from baseline hierarchical logistic model. Note that the teams with random effects greater than 1 are generally stronger teams.
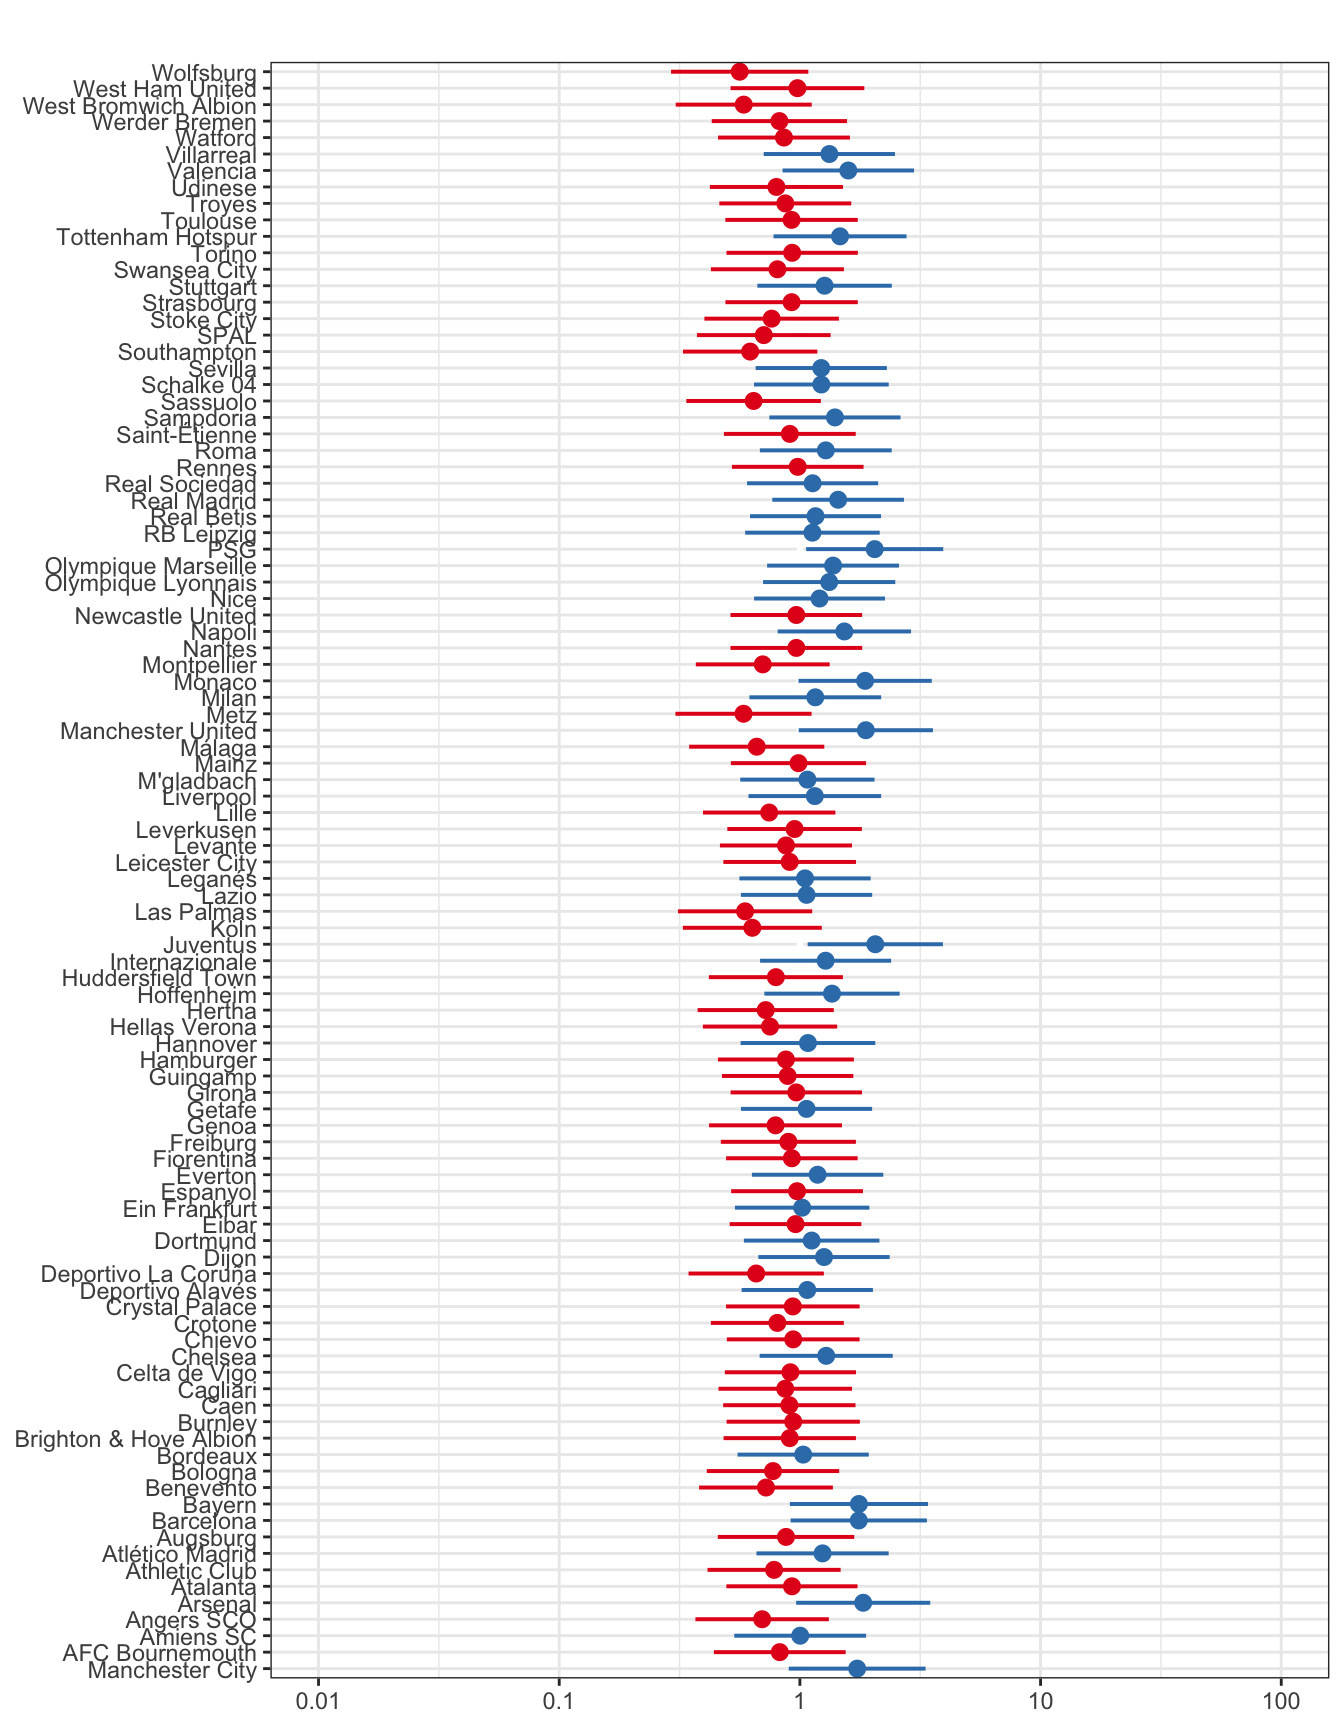
Figure 6.6: Random effects for Home from pace hierarchical logistic model.
The three assumptions for a hierachical logistic regression are linearity, randomness and independence.
Linearity: Linearity is mostly satisfied. There are no obvious patterns in the plots of the binned residuals vs. Unbeaten or residuals vs. \(\Delta_{ij}^{FZ}\). The average residuals vs. Derby are also all close to 0. However, the binned residuals vs. the predicted probabilities show a slight linear trend; as the predicted probability of winning increases, the residuals also increases. This is one limitation with the hierarchical logistic models.
Randomness: Our data utilizes all the regular-season games from the 2017-2018 season, and not a sample, so the randomness condition is satisfied. We also do not have reason to believe that this season’s games differ systemtically from that of other seasons.
Independence: Even though the games are not completely independent, we believe that the independence condition is satisfied. Games in other sports, such as basketball, may be more dependent, since teams will often play back to back nights, and so fatigue or momentum may impact the second or third consecutive day of games. In soccer, teams will generally have one week in between consecutive regular-season games, which is plenty of time to rest. In addition, momentum in soccer does not necessarily exist on a game-by-game basis; even though a team may be on a win or unbeaten streak, it is hard to tell if that streak will continue, because soccer match outcomes are much more unpredictable than that of other sports.
Quadratic terms for Unbeaten and the pace variable \(\Delta_{ij}^{FZ}\) were also considered. Neither modification significantly improved the models’ performance or helped further satisfy the linearity condition.
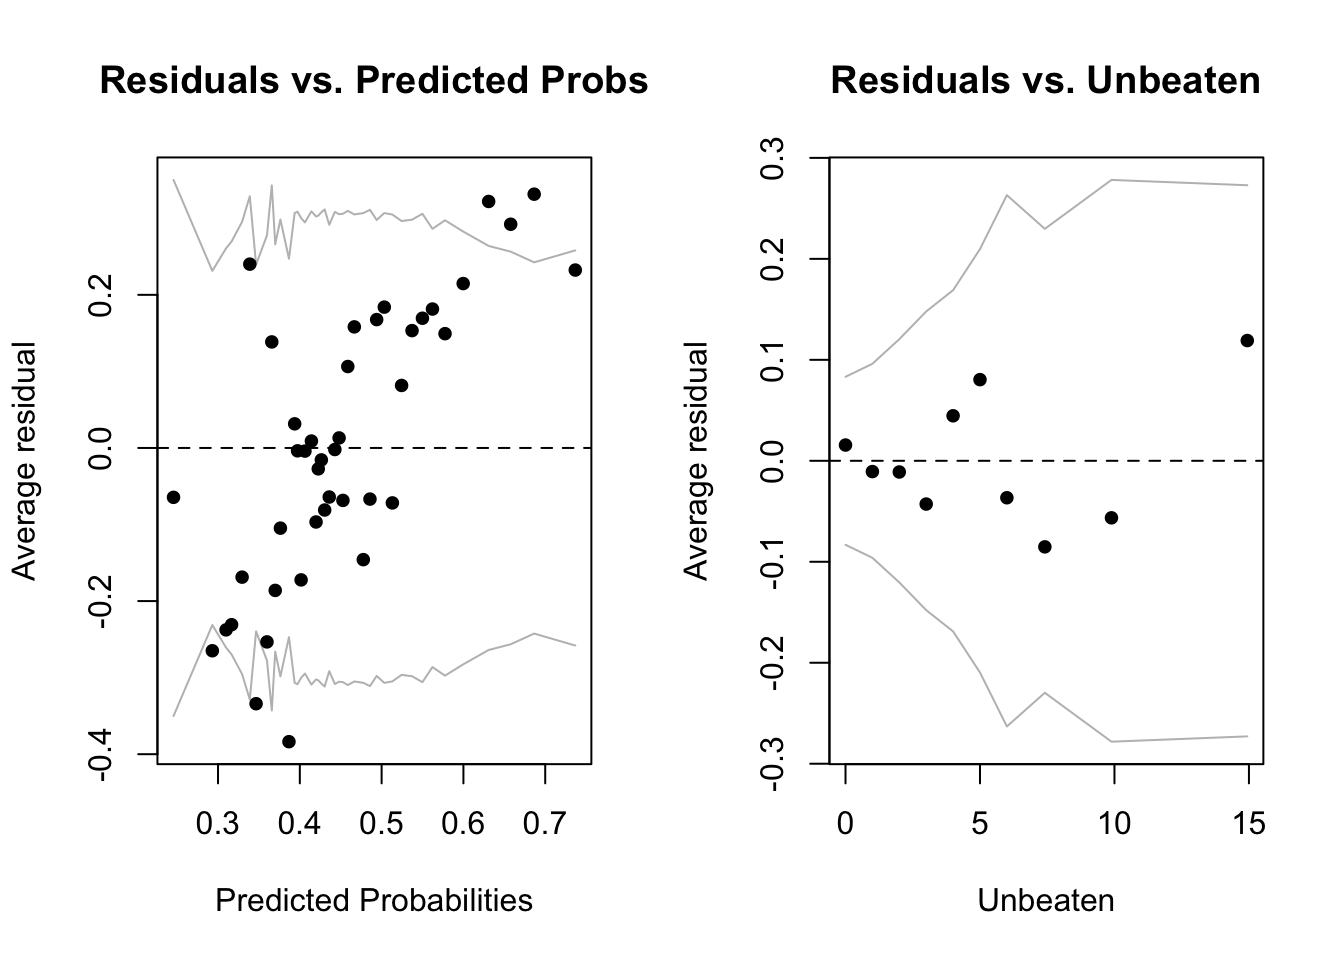
Figure 6.7: Binned residual plots for the baseline hierarchical logistic model.
| Derby | Mean Residual |
|---|---|
| Draw/Loss | 0.000 |
| Win | 0.013 |
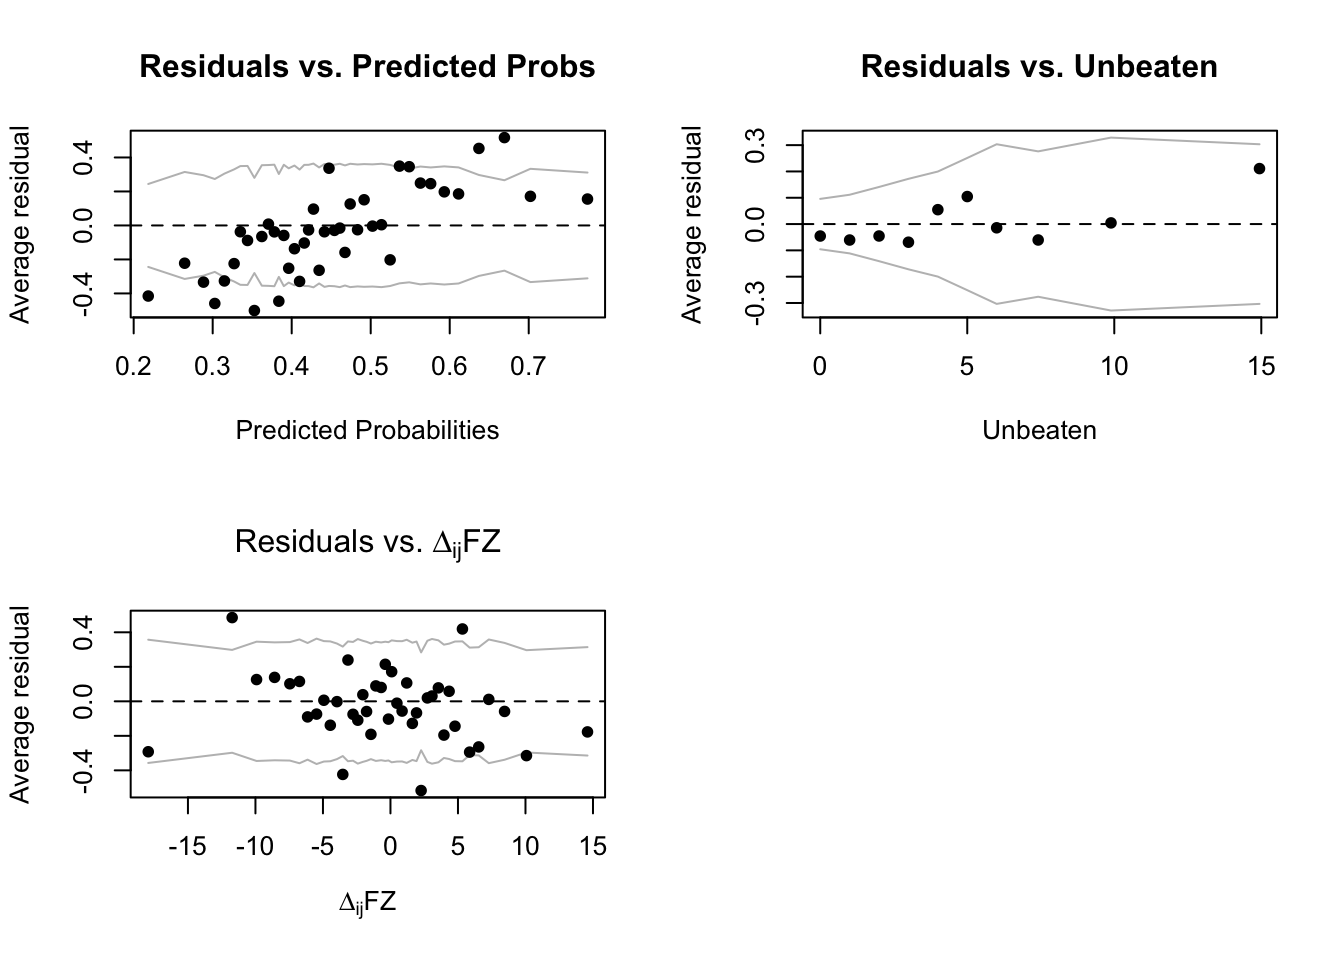
Figure 6.8: Binned residual plots for the pace hierarchical logistic model.
| Derby | Mean Residual |
|---|---|
| Draw/Loss | -0.027 |
| Win | -0.089 |
Multinomial Logistic Model Diagnostics
| Model | Mean Accuracy | Accuracy |
|---|---|---|
| Baseline | 45.27% | 45.15% |
| \(\Delta_{ij}^{AZ}\) | 43.71% | 44.39% |
| \(\Delta_{ij}^{OZ}\) | 44.98% | 45.92% |
| \(\Delta_{ij}^{FZ}\) | 45.23% | 46.68% |
| Predictor | Log Odds | Odds Ratio | p-value | Log Odds | Odds Ratio | p-value |
|---|---|---|---|---|---|---|
| homeAFC Bournemouth | -2.2 | 0.11 (0.01, 1.7) | 0.11 | -3.96 | 0.02 (0, 0.21) | < 0.01 |
| homeAmiens SC | -2.06 | 0.13 (0.01, 2) | 0.14 | -3.68 | 0.03 (0, 0.27) | < 0.01 |
| homeAngers SCO | -1.83 | 0.16 (0.01, 2.36) | 0.18 | -4.26 | 0.01 (0, 0.16) | < 0.01 |
| homeArsenal | -1.62 | 0.2 (0.01, 4.62) | 0.31 | -1.35 | 0.26 (0.02, 3.43) | 0.3 |
| homeAtalanta | -1.14 | 0.32 (0.02, 5.12) | 0.42 | -2.84 | 0.06 (0, 0.66) | 0.02 |
| homeAthletic Club | -1.04 | 0.35 (0.02, 5.31) | 0.45 | -3.44 | 0.03 (0, 0.36) | < 0.01 |
| homeAtlético Madrid | 1.21 | 3.37 (0.13, 86.38) | 0.46 | -0.19 | 0.83 (0.04, 15.46) | 0.9 |
| homeAugsburg | -2.38 | 0.09 (0.01, 1.48) | 0.09 | -3.99 | 0.02 (0, 0.2) | < 0.01 |
| homeBarcelona | 10.01 | 22322.27 (8477.4, 58777.88) | < 0.001 | 9.69 | 16076.74 (6041.45, 42781.41) | < 0.001 |
| homeBayern | 0.19 | 1.21 (0.04, 37.35) | 0.92 | 0.16 | 1.18 (0.06, 21.98) | 0.91 |
| homeBenevento | -3.82 | 0.02 (0, 0.4) | 0.01 | -4.98 | 0.01 (0, 0.07) | < 0.001 |
| homeBologna | -2.78 | 0.06 (0, 0.97) | 0.05 | -4.46 | 0.01 (0, 0.12) | < 0.001 |
| homeBordeaux | -2.23 | 0.11 (0.01, 1.75) | 0.12 | -3.51 | 0.03 (0, 0.32) | < 0.01 |
| homeBrighton & Hove Albion | -1.08 | 0.34 (0.02, 5.3) | 0.44 | -3.26 | 0.04 (0, 0.45) | < 0.01 |
| homeBurnley | -2.18 | 0.11 (0.01, 1.74) | 0.12 | -3.93 | 0.02 (0, 0.21) | < 0.01 |
| homeCaen | -2.26 | 0.1 (0.01, 1.62) | 0.11 | -4.01 | 0.02 (0, 0.2) | < 0.01 |
| homeCagliari | -3.18 | 0.04 (0, 0.69) | 0.03 | -4.57 | 0.01 (0, 0.11) | < 0.001 |
| homeCelta de Vigo | -0.49 | 0.61 (0.04, 10.04) | 0.73 | -2.56 | 0.08 (0.01, 0.95) | 0.04 |
| homeChelsea | -1.73 | 0.18 (0.01, 3.02) | 0.23 | -2.51 | 0.08 (0.01, 0.91) | 0.04 |
| homeChievo | -1.89 | 0.15 (0.01, 2.3) | 0.17 | -3.77 | 0.02 (0, 0.25) | < 0.01 |
| homeCrotone | -2.06 | 0.13 (0.01, 1.93) | 0.14 | -4.14 | 0.02 (0, 0.17) | < 0.01 |
| homeCrystal Palace | -2.21 | 0.11 (0.01, 1.69) | 0.11 | -3.67 | 0.03 (0, 0.28) | < 0.01 |
| homeDeportivo Alavés | -4.01 | 0.02 (0, 0.46) | 0.01 | -3.9 | 0.02 (0, 0.21) | < 0.01 |
| homeDeportivo La Coruña | -2.31 | 0.1 (0.01, 1.46) | 0.09 | -4.76 | 0.01 (0, 0.1) | < 0.001 |
| homeDijon | -2.05 | 0.13 (0.01, 2.24) | 0.16 | -2.86 | 0.06 (0, 0.61) | 0.02 |
| homeDortmund | -1.44 | 0.24 (0.01, 4.04) | 0.32 | -2.56 | 0.08 (0.01, 0.87) | 0.04 |
| homeEibar | -2.42 | 0.09 (0.01, 1.42) | 0.09 | -3.82 | 0.02 (0, 0.23) | < 0.01 |
| homeEin Frankfurt | -1.89 | 0.15 (0.01, 2.49) | 0.19 | -3.3 | 0.04 (0, 0.41) | < 0.01 |
| homeEspanyol | -1.66 | 0.19 (0.01, 2.96) | 0.24 | -3.4 | 0.03 (0, 0.37) | < 0.01 |
| homeEverton | -2.07 | 0.13 (0.01, 2.1) | 0.15 | -3.17 | 0.04 (0, 0.46) | < 0.01 |
| homeFiorentina | -1.98 | 0.14 (0.01, 2.15) | 0.16 | -3.61 | 0.03 (0, 0.29) | < 0.01 |
| homeFreiburg | -1.28 | 0.28 (0.02, 4.46) | 0.37 | -3.23 | 0.04 (0, 0.46) | 0.01 |
| homeGenoa | -3.16 | 0.04 (0, 0.7) | 0.03 | -4.49 | 0.01 (0, 0.12) | < 0.001 |
| homeGetafe | -1.97 | 0.14 (0.01, 2.24) | 0.16 | -3.27 | 0.04 (0, 0.4) | < 0.01 |
| homeGirona | -2.79 | 0.06 (0, 1.03) | 0.05 | -3.9 | 0.02 (0, 0.21) | < 0.01 |
| homeGuingamp | -1.02 | 0.36 (0.02, 5.69) | 0.47 | -2.99 | 0.05 (0, 0.57) | 0.02 |
| homeHamburger | -2.52 | 0.08 (0, 1.28) | 0.07 | -4.13 | 0.02 (0, 0.18) | < 0.01 |
| homeHannover | -2.56 | 0.08 (0, 1.32) | 0.08 | -3.67 | 0.03 (0, 0.28) | < 0.01 |
| homeHellas Verona | -4.61 | 0.01 (0, 0.25) | < 0.01 | -5.02 | 0.01 (0, 0.07) | < 0.001 |
| homeHertha | -1.49 | 0.22 (0.01, 3.45) | 0.28 | -3.92 | 0.02 (0, 0.23) | < 0.01 |
| homeHoffenheim | -0.72 | 0.49 (0.02, 9.87) | 0.64 | -1.82 | 0.16 (0.01, 2.21) | 0.17 |
| homeHuddersfield Town | -2.42 | 0.09 (0.01, 1.36) | 0.08 | -4.32 | 0.01 (0, 0.14) | < 0.001 |
| homeInternazionale | -0.93 | 0.39 (0.02, 6.74) | 0.52 | -2.13 | 0.12 (0.01, 1.4) | 0.09 |
| homeJuventus | -1.89 | 0.15 (0, 4.75) | 0.28 | -1.03 | 0.36 (0.03, 4.71) | 0.43 |
| homeKöln | -2.52 | 0.08 (0, 1.22) | 0.07 | -5.12 | 0.01 (0, 0.07) | < 0.001 |
| homeLas Palmas | -3.9 | 0.02 (0, 0.37) | < 0.01 | -5.28 | 0 (0, 0.06) | < 0.001 |
| homeLazio | -1.83 | 0.16 (0.01, 2.55) | 0.2 | -3.28 | 0.04 (0, 0.42) | < 0.01 |
| homeLeganés | -2.28 | 0.1 (0.01, 1.66) | 0.11 | -3.56 | 0.03 (0, 0.3) | < 0.01 |
| homeLeicester City | -1.83 | 0.16 (0.01, 2.45) | 0.19 | -3.77 | 0.02 (0, 0.25) | < 0.01 |
| homeLevante | -1.86 | 0.16 (0.01, 2.38) | 0.18 | -3.74 | 0.02 (0, 0.26) | < 0.01 |
| homeLeverkusen | -1.42 | 0.24 (0.01, 3.96) | 0.32 | -3.06 | 0.05 (0, 0.54) | 0.01 |
| homeLille | -2.11 | 0.12 (0.01, 1.84) | 0.13 | -4.19 | 0.01 (0, 0.17) | < 0.01 |
| homeLiverpool | 10.69 | 43991.32 (18334.64, 105550.82) | < 0.001 | 9.19 | 9770.09 (4023.2, 23726.1) | < 0.001 |
| homeM’gladbach | -1.79 | 0.17 (0.01, 2.86) | 0.22 | -3.07 | 0.05 (0, 0.53) | 0.01 |
| homeMainz | -2.75 | 0.06 (0, 1.08) | 0.06 | -3.99 | 0.02 (0, 0.2) | < 0.01 |
| homeMálaga | -3.39 | 0.03 (0, 0.55) | 0.02 | -5.19 | 0.01 (0, 0.06) | < 0.001 |
| homeManchester United | -1.28 | 0.28 (0.01, 6.48) | 0.43 | -1.21 | 0.3 (0.02, 3.96) | 0.36 |
| homeMetz | -3.06 | 0.05 (0, 0.72) | 0.03 | -5.43 | 0 (0, 0.05) | < 0.001 |
| homeMilan | -1.51 | 0.22 (0.01, 3.62) | 0.29 | -2.86 | 0.06 (0, 0.65) | 0.02 |
| homeMonaco | -0.1 | 0.91 (0.03, 25.41) | 0.95 | -0.54 | 0.59 (0.03, 10.82) | 0.72 |
| homeMontpellier | -1.21 | 0.3 (0.02, 4.47) | 0.38 | -3.89 | 0.02 (0, 0.24) | < 0.01 |
| homeNantes | -2.4 | 0.09 (0.01, 1.45) | 0.09 | -3.8 | 0.02 (0, 0.24) | < 0.01 |
| homeNapoli | -1.17 | 0.31 (0.01, 6.48) | 0.45 | -1.67 | 0.19 (0.01, 2.51) | 0.21 |
| homeNewcastle United | -2.32 | 0.1 (0.01, 1.56) | 0.1 | -3.73 | 0.02 (0, 0.26) | < 0.01 |
| homeNice | -2.59 | 0.07 (0, 1.29) | 0.07 | -3.47 | 0.03 (0, 0.33) | < 0.01 |
| homeOlympique Lyonnais | -0.73 | 0.48 (0.03, 9.36) | 0.63 | -1.8 | 0.16 (0.01, 2.2) | 0.17 |
| homeOlympique Marseille | -0.41 | 0.66 (0.03, 12.69) | 0.78 | -1.52 | 0.22 (0.02, 2.92) | 0.25 |
| homePSG | -0.21 | 0.81 (0.02, 32.88) | 0.91 | 0.62 | 1.86 (0.1, 35.04) | 0.68 |
| homeRB Leipzig | -1.72 | 0.18 (0.01, 3.05) | 0.23 | -3.01 | 0.05 (0, 0.56) | 0.01 |
| homeReal Betis | -2.05 | 0.13 (0.01, 2.12) | 0.15 | -3.17 | 0.04 (0, 0.46) | < 0.01 |
| homeReal Madrid | -1.3 | 0.27 (0.01, 4.85) | 0.38 | -2.17 | 0.11 (0.01, 1.35) | 0.09 |
| homeReal Sociedad | -2.53 | 0.08 (0, 1.36) | 0.08 | -3.42 | 0.03 (0, 0.35) | < 0.01 |
| homeRennes | -2.47 | 0.09 (0, 1.35) | 0.08 | -3.86 | 0.02 (0, 0.22) | < 0.01 |
| homeRoma | -2.94 | 0.05 (0, 1.01) | 0.05 | -3.19 | 0.04 (0, 0.44) | < 0.01 |
| homeSaint-Étienne | -1.14 | 0.32 (0.02, 5.07) | 0.42 | -3.04 | 0.05 (0, 0.55) | 0.01 |
| homeSampdoria | -1.99 | 0.14 (0.01, 2.46) | 0.18 | -2.62 | 0.07 (0.01, 0.81) | 0.03 |
| homeSassuolo | -1.99 | 0.14 (0.01, 2) | 0.15 | -4.64 | 0.01 (0, 0.11) | < 0.001 |
| homeSchalke 04 | -0.66 | 0.52 (0.03, 9.99) | 0.66 | -2 | 0.14 (0.01, 1.83) | 0.13 |
| homeSevilla | -0.97 | 0.38 (0.02, 6.57) | 0.51 | -2.23 | 0.11 (0.01, 1.28) | 0.08 |
| homeSouthampton | -2.1 | 0.12 (0.01, 1.81) | 0.13 | -4.74 | 0.01 (0, 0.1) | < 0.001 |
| homeSPAL | -1.59 | 0.2 (0.01, 3.02) | 0.25 | -4.15 | 0.02 (0, 0.18) | < 0.01 |
| homeStoke City | -2.56 | 0.08 (0, 1.17) | 0.06 | -4.64 | 0.01 (0, 0.11) | < 0.001 |
| homeStrasbourg | -1.85 | 0.16 (0.01, 2.42) | 0.18 | -3.78 | 0.02 (0, 0.25) | < 0.01 |
| homeStuttgart | -1.37 | 0.25 (0.01, 4.55) | 0.35 | -2.56 | 0.08 (0.01, 0.92) | 0.04 |
| homeSwansea City | -3.1 | 0.04 (0, 0.74) | 0.03 | -4.5 | 0.01 (0, 0.12) | < 0.001 |
| homeTorino | -1.66 | 0.19 (0.01, 2.96) | 0.24 | -3.42 | 0.03 (0, 0.37) | < 0.01 |
| homeTottenham Hotspur | -0.05 | 0.95 (0.05, 19.14) | 0.97 | -0.74 | 0.48 (0.04, 6.58) | 0.58 |
| homeToulouse | -2.28 | 0.1 (0.01, 1.58) | 0.1 | -4.03 | 0.02 (0, 0.19) | < 0.01 |
| homeTroyes | -3.07 | 0.05 (0, 0.77) | 0.03 | -4.31 | 0.01 (0, 0.14) | < 0.001 |
| homeUdinese | -3.64 | 0.03 (0, 0.48) | 0.01 | -4.63 | 0.01 (0, 0.1) | < 0.001 |
| homeValencia | -1.62 | 0.2 (0.01, 3.74) | 0.28 | -2.11 | 0.12 (0.01, 1.44) | 0.09 |
| homeVillarreal | -2.33 | 0.1 (0.01, 1.7) | 0.11 | -3.05 | 0.05 (0, 0.51) | 0.01 |
| homeWatford | -1.89 | 0.15 (0.01, 2.32) | 0.17 | -3.83 | 0.02 (0, 0.24) | < 0.01 |
| homeWerder Bremen | -0.83 | 0.43 (0.03, 6.81) | 0.55 | -3.05 | 0.05 (0, 0.56) | 0.01 |
| homeWest Bromwich Albion | -1.65 | 0.19 (0.01, 2.78) | 0.23 | -4.84 | 0.01 (0, 0.1) | < 0.001 |
| homeWest Ham United | -1.94 | 0.14 (0.01, 2.2) | 0.16 | -3.64 | 0.03 (0, 0.29) | < 0.01 |
| homeWolfsburg | -1.42 | 0.24 (0.02, 3.57) | 0.3 | -4.5 | 0.01 (0, 0.14) | < 0.01 |
| Predictor | Log Odds | Odds Ratio | p-value | Log Odds | Odds Ratio | p-value |
|---|---|---|---|---|---|---|
| homeAFC Bournemouth | -1.89 | 0.15 (0.01, 2.33) | 0.17 | -3.59 | 0.03 (0, 0.3) | < 0.01 |
| homeAmiens SC | -1.52 | 0.22 (0.01, 3.45) | 0.28 | -3.04 | 0.05 (0, 0.52) | 0.01 |
| homeAngers SCO | -1.43 | 0.24 (0.02, 3.57) | 0.3 | -3.77 | 0.02 (0, 0.26) | < 0.01 |
| homeArsenal | -1.46 | 0.23 (0.01, 5.42) | 0.36 | -1.18 | 0.31 (0.02, 4.11) | 0.37 |
| homeAtalanta | -0.93 | 0.39 (0.02, 6.34) | 0.51 | -2.6 | 0.07 (0.01, 0.85) | 0.04 |
| homeAthletic Club | -0.53 | 0.59 (0.04, 8.91) | 0.7 | -2.83 | 0.06 (0, 0.68) | 0.02 |
| homeAtlético Madrid | 1.56 | 4.74 (0.18, 122.56) | 0.35 | 0.22 | 1.24 (0.07, 23.48) | 0.88 |
| homeAugsburg | -1.88 | 0.15 (0.01, 2.45) | 0.18 | -3.42 | 0.03 (0, 0.36) | < 0.01 |
| homeBarcelona | 10.69 | 43735.63 (16573.54, 115413.22) | < 0.001 | 10.39 | 32396.44 (12199.52, 86030.33) | < 0.001 |
| homeBayern | 0.52 | 1.68 (0.05, 52.91) | 0.77 | 0.55 | 1.73 (0.09, 33.04) | 0.71 |
| homeBenevento | -3.4 | 0.03 (0, 0.62) | 0.02 | -4.47 | 0.01 (0, 0.12) | < 0.001 |
| homeBologna | -2.43 | 0.09 (0.01, 1.39) | 0.08 | -4.03 | 0.02 (0, 0.19) | < 0.01 |
| homeBordeaux | -1.85 | 0.16 (0.01, 2.56) | 0.19 | -3.06 | 0.05 (0, 0.5) | 0.01 |
| homeBrighton & Hove Albion | -0.57 | 0.56 (0.04, 8.9) | 0.69 | -2.64 | 0.07 (0.01, 0.84) | 0.04 |
| homeBurnley | -1.54 | 0.21 (0.01, 3.37) | 0.27 | -3.18 | 0.04 (0, 0.46) | < 0.01 |
| homeCaen | -1.74 | 0.17 (0.01, 2.73) | 0.21 | -3.39 | 0.03 (0, 0.37) | < 0.01 |
| homeCagliari | -2.54 | 0.08 (0, 1.31) | 0.08 | -3.8 | 0.02 (0, 0.24) | < 0.01 |
| homeCelta de Vigo | -0.13 | 0.88 (0.05, 14.39) | 0.93 | -2.12 | 0.12 (0.01, 1.47) | 0.1 |
| homeChelsea | -1.44 | 0.24 (0.01, 4.04) | 0.32 | -2.19 | 0.11 (0.01, 1.26) | 0.08 |
| homeChievo | -1.33 | 0.26 (0.02, 4.08) | 0.34 | -3.1 | 0.04 (0, 0.5) | 0.01 |
| homeCrotone | -1.57 | 0.21 (0.01, 3.16) | 0.26 | -3.56 | 0.03 (0, 0.32) | < 0.01 |
| homeCrystal Palace | -1.83 | 0.16 (0.01, 2.49) | 0.19 | -3.22 | 0.04 (0, 0.44) | < 0.01 |
| homeDeportivo Alavés | -3.55 | 0.03 (0, 0.73) | 0.03 | -3.36 | 0.04 (0, 0.36) | < 0.01 |
| homeDeportivo La Coruña | -1.85 | 0.16 (0.01, 2.34) | 0.18 | -4.2 | 0.01 (0, 0.17) | < 0.01 |
| homeDijon | -1.61 | 0.2 (0.01, 3.5) | 0.27 | -2.34 | 0.1 (0.01, 1.04) | 0.05 |
| homeDortmund | -1.11 | 0.33 (0.02, 5.61) | 0.44 | -2.18 | 0.11 (0.01, 1.28) | 0.08 |
| homeEibar | -2 | 0.14 (0.01, 2.18) | 0.16 | -3.31 | 0.04 (0, 0.39) | < 0.01 |
| homeEin Frankfurt | -1.5 | 0.22 (0.01, 3.69) | 0.3 | -2.83 | 0.06 (0, 0.66) | 0.02 |
| homeEspanyol | -1.24 | 0.29 (0.02, 4.55) | 0.38 | -2.9 | 0.06 (0, 0.62) | 0.02 |
| homeEverton | -1.65 | 0.19 (0.01, 3.19) | 0.25 | -2.68 | 0.07 (0.01, 0.75) | 0.03 |
| homeFiorentina | -1.6 | 0.2 (0.01, 3.17) | 0.26 | -3.15 | 0.04 (0, 0.46) | 0.01 |
| homeFreiburg | -0.92 | 0.4 (0.03, 6.39) | 0.51 | -2.81 | 0.06 (0, 0.71) | 0.03 |
| homeGenoa | -2.79 | 0.06 (0, 1.02) | 0.05 | -4.03 | 0.02 (0, 0.19) | < 0.01 |
| homeGetafe | -1.46 | 0.23 (0.01, 3.75) | 0.3 | -2.66 | 0.07 (0.01, 0.75) | 0.03 |
| homeGirona | -2.35 | 0.1 (0.01, 1.61) | 0.1 | -3.37 | 0.03 (0, 0.36) | < 0.01 |
| homeGuingamp | -0.67 | 0.51 (0.03, 8.08) | 0.63 | -2.59 | 0.07 (0.01, 0.87) | 0.04 |
| homeHamburger | -2.11 | 0.12 (0.01, 1.96) | 0.14 | -3.63 | 0.03 (0, 0.3) | < 0.01 |
| homeHannover | -2.09 | 0.12 (0.01, 2.14) | 0.15 | -3.1 | 0.04 (0, 0.49) | 0.01 |
| homeHellas Verona | -4.15 | 0.02 (0, 0.39) | 0.01 | -4.46 | 0.01 (0, 0.13) | < 0.001 |
| homeHertha | -1.17 | 0.31 (0.02, 4.78) | 0.4 | -3.55 | 0.03 (0, 0.34) | < 0.01 |
| homeHoffenheim | -0.37 | 0.69 (0.03, 13.95) | 0.81 | -1.4 | 0.25 (0.02, 3.35) | 0.29 |
| homeHuddersfield Town | -1.93 | 0.14 (0.01, 2.24) | 0.17 | -3.76 | 0.02 (0, 0.26) | < 0.01 |
| homeInternazionale | -0.57 | 0.56 (0.03, 9.71) | 0.69 | -1.69 | 0.18 (0.02, 2.19) | 0.18 |
| homeJuventus | -1.51 | 0.22 (0.01, 6.9) | 0.39 | -0.59 | 0.55 (0.04, 7.32) | 0.65 |
| homeKöln | -2.02 | 0.13 (0.01, 2.03) | 0.15 | -4.52 | 0.01 (0, 0.14) | < 0.001 |
| homeLas Palmas | -3.7 | 0.03 (0, 0.45) | 0.01 | -5.05 | 0.01 (0, 0.07) | < 0.001 |
| homeLazio | -1.45 | 0.23 (0.01, 3.78) | 0.31 | -2.8 | 0.06 (0.01, 0.67) | 0.02 |
| homeLeganés | -1.89 | 0.15 (0.01, 2.45) | 0.18 | -3.1 | 0.04 (0, 0.49) | 0.01 |
| homeLeicester City | -1.27 | 0.28 (0.02, 4.32) | 0.36 | -3.11 | 0.04 (0, 0.5) | 0.01 |
| homeLevante | -1.47 | 0.23 (0.01, 3.51) | 0.29 | -3.27 | 0.04 (0, 0.42) | < 0.01 |
| homeLeverkusen | -1.22 | 0.3 (0.02, 4.87) | 0.4 | -2.8 | 0.06 (0, 0.7) | 0.02 |
| homeLille | -1.82 | 0.16 (0.01, 2.46) | 0.19 | -3.85 | 0.02 (0, 0.24) | < 0.01 |
| homeLiverpool | 11.4 | 89773.55 (37305.14, 216037.01) | < 0.001 | 9.93 | 20552.3 (8484.1, 49786.86) | < 0.001 |
| homeM’gladbach | -1.55 | 0.21 (0.01, 3.61) | 0.28 | -2.79 | 0.06 (0, 0.7) | 0.03 |
| homeMainz | -2.23 | 0.11 (0.01, 1.83) | 0.12 | -3.37 | 0.03 (0, 0.37) | < 0.01 |
| homeMálaga | -2.91 | 0.05 (0, 0.89) | 0.04 | -4.61 | 0.01 (0, 0.11) | < 0.001 |
| homeManchester United | -0.79 | 0.45 (0.02, 10.63) | 0.62 | -0.68 | 0.5 (0.04, 6.93) | 0.61 |
| homeMetz | -2.61 | 0.07 (0, 1.14) | 0.06 | -4.89 | 0.01 (0, 0.09) | < 0.001 |
| homeMilan | -1.09 | 0.34 (0.02, 5.58) | 0.45 | -2.37 | 0.09 (0.01, 1.07) | 0.06 |
| homeMonaco | 0.39 | 1.47 (0.05, 41.53) | 0.82 | 0.03 | 1.03 (0.06, 19.34) | 0.98 |
| homeMontpellier | -0.76 | 0.47 (0.03, 7.09) | 0.58 | -3.35 | 0.04 (0, 0.41) | < 0.01 |
| homeNantes | -1.96 | 0.14 (0.01, 2.25) | 0.16 | -3.27 | 0.04 (0, 0.4) | < 0.01 |
| homeNapoli | -1.07 | 0.34 (0.02, 7.19) | 0.49 | -1.54 | 0.21 (0.02, 2.86) | 0.24 |
| homeNewcastle United | -1.86 | 0.16 (0.01, 2.5) | 0.19 | -3.17 | 0.04 (0, 0.45) | < 0.01 |
| homeNice | -2.12 | 0.12 (0.01, 2.08) | 0.14 | -2.91 | 0.06 (0, 0.58) | 0.02 |
| homeOlympique Lyonnais | -0.48 | 0.62 (0.03, 12) | 0.75 | -1.51 | 0.22 (0.02, 2.94) | 0.25 |
| homeOlympique Marseille | -0.08 | 0.92 (0.05, 17.67) | 0.96 | -1.13 | 0.32 (0.02, 4.35) | 0.4 |
| homePSG | 0.09 | 1.1 (0.03, 45.25) | 0.96 | 0.97 | 2.64 (0.14, 51.01) | 0.52 |
| homeRB Leipzig | -1.38 | 0.25 (0.01, 4.31) | 0.34 | -2.59 | 0.07 (0.01, 0.85) | 0.04 |
| homeReal Betis | -1.71 | 0.18 (0.01, 2.99) | 0.23 | -2.76 | 0.06 (0.01, 0.7) | 0.02 |
| homeReal Madrid | -0.89 | 0.41 (0.02, 7.38) | 0.55 | -1.69 | 0.19 (0.02, 2.22) | 0.18 |
| homeReal Sociedad | -2.19 | 0.11 (0.01, 1.92) | 0.13 | -3.02 | 0.05 (0, 0.52) | 0.01 |
| homeRennes | -2.02 | 0.13 (0.01, 2.14) | 0.16 | -3.32 | 0.04 (0, 0.39) | < 0.01 |
| homeRoma | -2.63 | 0.07 (0, 1.39) | 0.08 | -2.82 | 0.06 (0.01, 0.64) | 0.02 |
| homeSaint-Étienne | -0.83 | 0.44 (0.03, 6.93) | 0.56 | -2.68 | 0.07 (0.01, 0.79) | 0.03 |
| homeSampdoria | -1.64 | 0.19 (0.01, 3.48) | 0.26 | -2.2 | 0.11 (0.01, 1.23) | 0.07 |
| homeSassuolo | -1.54 | 0.22 (0.01, 3.15) | 0.26 | -4.09 | 0.02 (0, 0.19) | < 0.01 |
| homeSchalke 04 | -0.39 | 0.68 (0.04, 13.09) | 0.8 | -1.66 | 0.19 (0.01, 2.56) | 0.21 |
| homeSevilla | -0.66 | 0.52 (0.03, 9) | 0.65 | -1.86 | 0.16 (0.01, 1.87) | 0.14 |
| homeSouthampton | -1.75 | 0.17 (0.01, 2.58) | 0.2 | -4.32 | 0.01 (0, 0.16) | < 0.01 |
| homeSPAL | -1.15 | 0.32 (0.02, 4.72) | 0.4 | -3.63 | 0.03 (0, 0.31) | < 0.01 |
| homeStoke City | -1.97 | 0.14 (0.01, 2.14) | 0.16 | -3.94 | 0.02 (0, 0.22) | < 0.01 |
| homeStrasbourg | -1.26 | 0.28 (0.02, 4.38) | 0.37 | -3.09 | 0.05 (0, 0.51) | 0.01 |
| homeStuttgart | -0.92 | 0.4 (0.02, 7.22) | 0.53 | -2.03 | 0.13 (0.01, 1.59) | 0.11 |
| homeSwansea City | -2.62 | 0.07 (0, 1.2) | 0.07 | -3.93 | 0.02 (0, 0.21) | < 0.01 |
| homeTorino | -1.36 | 0.26 (0.02, 4.01) | 0.33 | -3.04 | 0.05 (0, 0.53) | 0.01 |
| homeTottenham Hotspur | 0.18 | 1.2 (0.06, 24.05) | 0.9 | -0.46 | 0.63 (0.05, 8.68) | 0.73 |
| homeToulouse | -1.74 | 0.18 (0.01, 2.75) | 0.22 | -3.38 | 0.03 (0, 0.37) | < 0.01 |
| homeTroyes | -2.68 | 0.07 (0, 1.14) | 0.06 | -3.84 | 0.02 (0, 0.23) | < 0.01 |
| homeUdinese | -3.19 | 0.04 (0, 0.76) | 0.03 | -4.09 | 0.02 (0, 0.18) | < 0.01 |
| homeValencia | -1.26 | 0.28 (0.01, 5.38) | 0.4 | -1.67 | 0.19 (0.02, 2.22) | 0.18 |
| homeVillarreal | -1.9 | 0.15 (0.01, 2.64) | 0.2 | -2.53 | 0.08 (0.01, 0.87) | 0.04 |
| homeWatford | -1.51 | 0.22 (0.01, 3.4) | 0.28 | -3.36 | 0.04 (0, 0.38) | < 0.01 |
| homeWerder Bremen | -0.41 | 0.66 (0.04, 10.59) | 0.77 | -2.53 | 0.08 (0.01, 0.95) | 0.05 |
| homeWest Bromwich Albion | -1.16 | 0.31 (0.02, 4.59) | 0.4 | -4.25 | 0.01 (0, 0.18) | < 0.01 |
| homeWest Ham United | -1.42 | 0.24 (0.02, 3.74) | 0.31 | -3.02 | 0.05 (0, 0.54) | 0.01 |
| homeWolfsburg | -1.15 | 0.32 (0.02, 4.71) | 0.4 | -4.18 | 0.01 (0, 0.2) | < 0.01 |
The three assumptions for a multinomial logistic regression are linearity, randomness and independence. Randomness and independence are satisfied, as the conditions for the multinomial logistic model are the same for the hierachical logistic model.
- Linearity: Linearity is satisfied. For all levels of the response variable (win, draw, loss), there are no obvious patterns in the plots of the binned residuals vs. predicted probabilities, binned residuals vs. Unbeaten or binned residuals vs. \(\Delta_{ij}^{FZ}\). The average residuals vs. Derby and average residuals vs. Home are also all close to 0 for each level of the response variable.
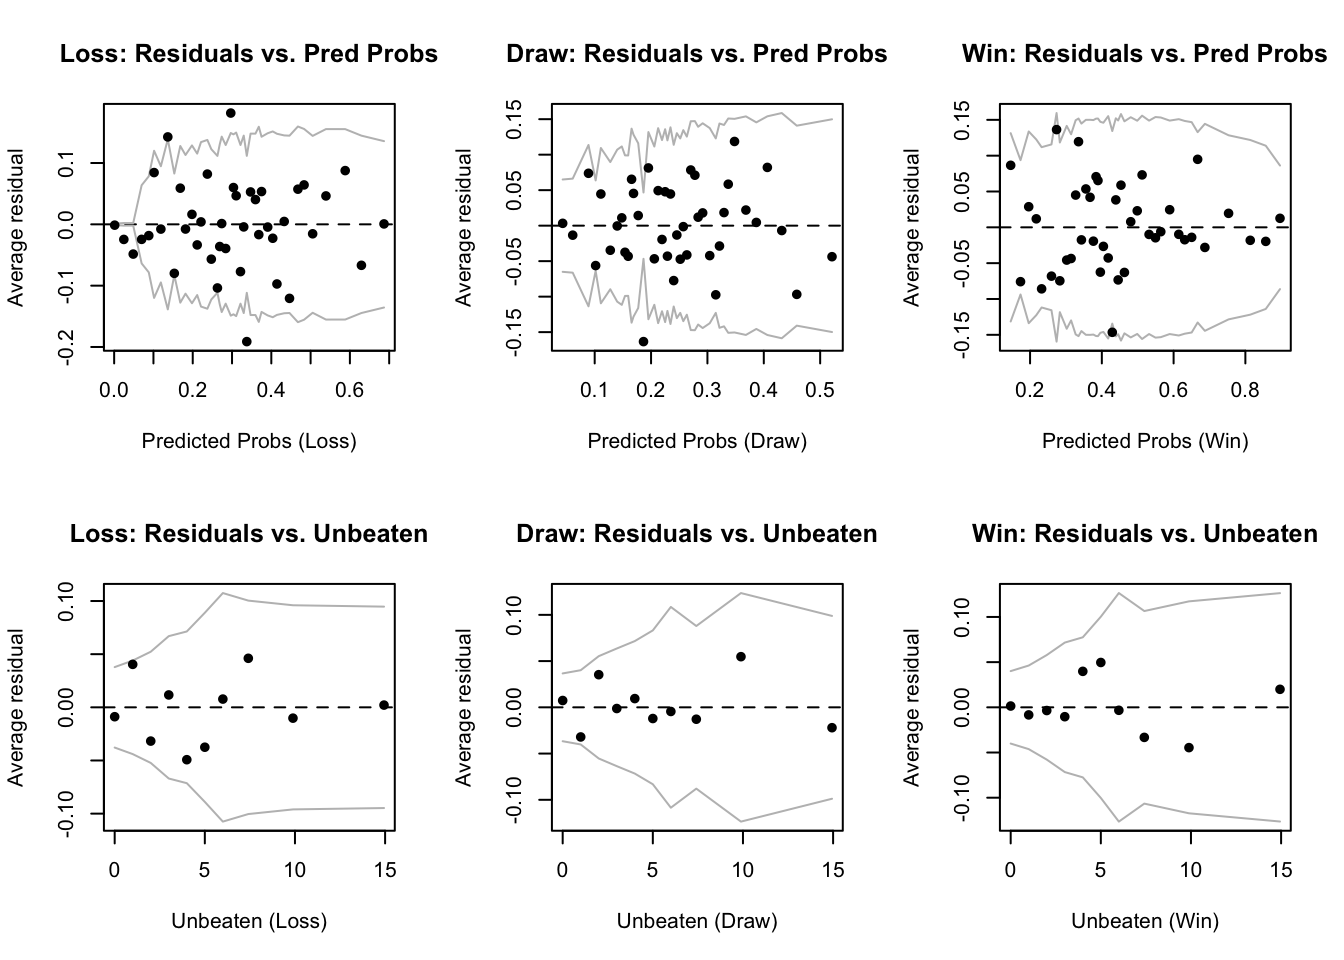
Figure 6.9: Binned residual plots for the baseline multinomial logistic model.
| 0 | 1 | |
|---|---|---|
| Loss | 1.61e-06 | 5.08e-06 |
| Draw | 4.44e-06 | 9.90e-07 |
| Win | 1.61e-06 | 5.08e-06 |
Scroll to see the average residuals vs. home for the baseline multinomial logistic model.
| Manchester City | AFC Bournemouth | Amiens SC | Angers SCO | Arsenal | Atalanta | Athletic Club | Atlético Madrid | Augsburg | Barcelona | Bayern | Benevento | Bologna | Bordeaux | Brighton & Hove Albion | Burnley | Caen | Cagliari | Celta de Vigo | Chelsea | Chievo | Crotone | Crystal Palace | Deportivo Alavés | Deportivo La Coruña | Dijon | Dortmund | Eibar | Ein Frankfurt | Espanyol | Everton | Fiorentina | Freiburg | Genoa | Getafe | Girona | Guingamp | Hamburger | Hannover | Hellas Verona | Hertha | Hoffenheim | Huddersfield Town | Internazionale | Juventus | Köln | Las Palmas | Lazio | Leganés | Leicester City | Levante | Leverkusen | Lille | Liverpool | M’gladbach | Mainz | Málaga | Manchester United | Metz | Milan | Monaco | Montpellier | Nantes | Napoli | Newcastle United | Nice | Olympique Lyonnais | Olympique Marseille | PSG | RB Leipzig | Real Betis | Real Madrid | Real Sociedad | Rennes | Roma | Saint-Étienne | Sampdoria | Sassuolo | Schalke 04 | Sevilla | Southampton | SPAL | Stoke City | Strasbourg | Stuttgart | Swansea City | Torino | Tottenham Hotspur | Toulouse | Troyes | Udinese | Valencia | Villarreal | Watford | Werder Bremen | West Bromwich Albion | West Ham United | Wolfsburg | |
|---|---|---|---|---|---|---|---|---|---|---|---|---|---|---|---|---|---|---|---|---|---|---|---|---|---|---|---|---|---|---|---|---|---|---|---|---|---|---|---|---|---|---|---|---|---|---|---|---|---|---|---|---|---|---|---|---|---|---|---|---|---|---|---|---|---|---|---|---|---|---|---|---|---|---|---|---|---|---|---|---|---|---|---|---|---|---|---|---|---|---|---|---|---|---|---|---|---|---|
| Loss | -0.000164 | -2e-06 | -1.9e-05 | 2.6e-05 | 4.0e-06 | 7e-06 | 2.0e-06 | 1.2e-05 | 4e-06 | -5.0e-06 | 2.4e-05 | 8e-06 | 8e-06 | 1.0e-05 | -0.000008 | -2e-06 | -2e-06 | -2e-06 | 3.0e-06 | 0e+00 | 0e+00 | 4.0e-06 | 7.0e-06 | 7e-06 | 2.1e-05 | 5e-06 | 3.0e-06 | -1.2e-05 | 2.0e-06 | 8e-06 | 6e-06 | -9e-06 | 6.0e-06 | 6e-06 | 4e-06 | 8.0e-06 | 6.0e-06 | 3e-06 | 6e-06 | -1.5e-05 | 0.0e+00 | 1.1e-05 | 1.1e-05 | 4.0e-06 | 1.3e-05 | 9.0e-06 | -2.4e-05 | 1.3e-05 | 1.0e-05 | 3e-06 | 2e-06 | 4.0e-06 | 4.0e-06 | -5.0e-06 | 4e-06 | 6e-06 | 2e-06 | 1.7e-05 | 7.0e-06 | -1.0e-06 | -1.1e-05 | 4e-06 | -1.1e-05 | 0e+00 | -7e-06 | 1.0e-05 | -2.0e-06 | 4.0e-06 | -8.5e-05 | 5e-06 | 7e-06 | 8.0e-06 | 8.0e-06 | -1.5e-05 | -5e-06 | -2.0e-06 | -2e-06 | 4.6e-05 | 4.0e-06 | 0.0e+00 | 3.7e-05 | 2.9e-05 | 0.0e+00 | 3e-06 | 9.0e-06 | -1.5e-05 | 9e-06 | 1.0e-05 | -2e-06 | 2e-06 | 6.1e-05 | 1.4e-05 | 1e-06 | 0.0e+00 | 3.0e-06 | 0e+00 | 2e-06 | 1.0e-06 |
| Draw | 0.000031 | 3e-06 | -5.6e-05 | -2.7e-05 | 2.3e-05 | 9e-06 | 6.4e-05 | 6.0e-06 | 4e-06 | 2.8e-05 | 3.4e-05 | 6e-06 | 6e-06 | 1.3e-05 | 0.000131 | 0e+00 | 7e-06 | 2e-06 | -2.4e-05 | -5e-06 | -4e-06 | -1.5e-05 | -2.2e-05 | 5e-06 | 5.0e-06 | 4e-06 | -1.1e-05 | -1.3e-05 | -1.2e-05 | 5e-06 | 9e-06 | -3e-05 | 2.5e-05 | 6e-06 | 3e-06 | 1.2e-05 | 3.6e-05 | 6e-06 | 6e-06 | 6.0e-06 | 1.9e-05 | 1.9e-05 | -1.4e-05 | 1.2e-05 | -1.0e-06 | -1.9e-05 | -8.0e-06 | 3.1e-05 | 1.4e-05 | 1e-05 | 6e-06 | -1.1e-05 | -1.4e-05 | 2.8e-05 | 4e-06 | 6e-06 | -6e-06 | 1.6e-05 | 1.8e-05 | -2.3e-05 | -4.9e-05 | 0e+00 | -1.1e-05 | 8e-06 | -6e-06 | 1.5e-05 | -1.5e-05 | -1.2e-05 | 1.3e-04 | 3e-06 | 9e-06 | 2.5e-05 | 1.3e-05 | -1.6e-05 | -4e-06 | -8.5e-05 | -3e-06 | -2.0e-05 | 1.9e-05 | -3.8e-05 | -1.8e-05 | -6.3e-05 | 1.5e-05 | 1e-05 | 2.7e-05 | -1.2e-05 | 0e+00 | -2.9e-05 | 9e-06 | 8e-06 | 2.6e-05 | 2.0e-05 | 6e-06 | 1.2e-05 | 8.3e-05 | -3e-06 | -1e-05 | 2.5e-05 |
| Win | -0.000164 | -2e-06 | -1.9e-05 | 2.6e-05 | 4.0e-06 | 7e-06 | 2.0e-06 | 1.2e-05 | 4e-06 | -5.0e-06 | 2.4e-05 | 8e-06 | 8e-06 | 1.0e-05 | -0.000008 | -2e-06 | -2e-06 | -2e-06 | 3.0e-06 | 0e+00 | 0e+00 | 4.0e-06 | 7.0e-06 | 7e-06 | 2.1e-05 | 5e-06 | 3.0e-06 | -1.2e-05 | 2.0e-06 | 8e-06 | 6e-06 | -9e-06 | 6.0e-06 | 6e-06 | 4e-06 | 8.0e-06 | 6.0e-06 | 3e-06 | 6e-06 | -1.5e-05 | 0.0e+00 | 1.1e-05 | 1.1e-05 | 4.0e-06 | 1.3e-05 | 9.0e-06 | -2.4e-05 | 1.3e-05 | 1.0e-05 | 3e-06 | 2e-06 | 4.0e-06 | 4.0e-06 | -5.0e-06 | 4e-06 | 6e-06 | 2e-06 | 1.7e-05 | 7.0e-06 | -1.0e-06 | -1.1e-05 | 4e-06 | -1.1e-05 | 0e+00 | -7e-06 | 1.0e-05 | -2.0e-06 | 4.0e-06 | -8.5e-05 | 5e-06 | 7e-06 | 8.0e-06 | 8.0e-06 | -1.5e-05 | -5e-06 | -2.0e-06 | -2e-06 | 4.6e-05 | 4.0e-06 | 0.0e+00 | 3.7e-05 | 2.9e-05 | 0.0e+00 | 3e-06 | 9.0e-06 | -1.5e-05 | 9e-06 | 1.0e-05 | -2e-06 | 2e-06 | 6.1e-05 | 1.4e-05 | 1e-06 | 0.0e+00 | 3.0e-06 | 0e+00 | 2e-06 | 1.0e-06 |
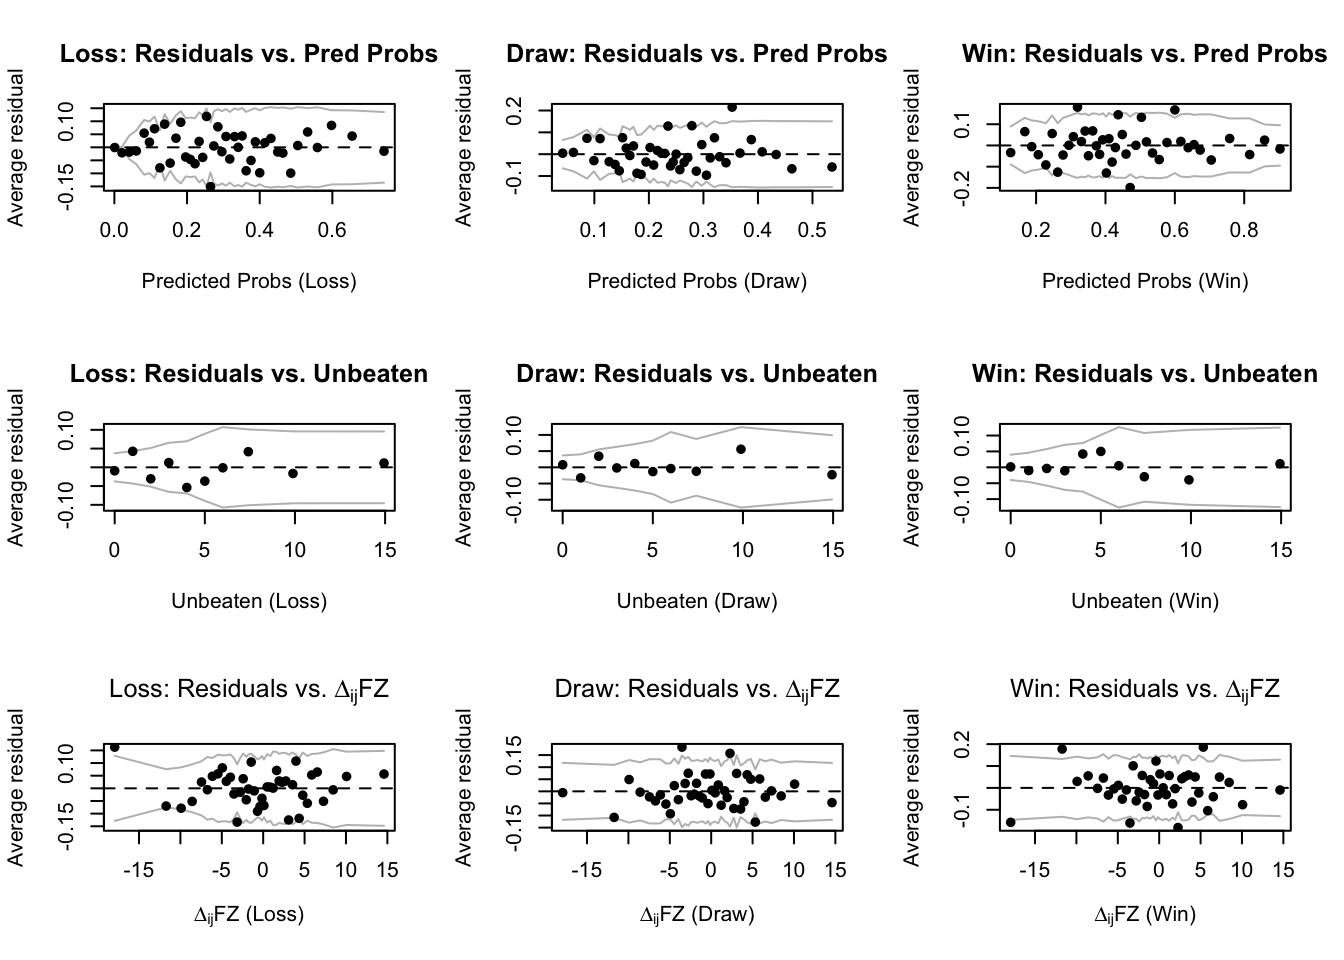
Figure 6.10: Binned residual plots for the pace multinomial logistic model.
| 0 | 1 | |
|---|---|---|
| Loss | 1.02e-06 | -9.520e-06 |
| Draw | 3.00e-08 | 1.999e-05 |
| Win | 1.02e-06 | -9.520e-06 |
Scroll to see the average residuals vs. home for the pace multinomial logistic model.
| Manchester City | AFC Bournemouth | Amiens SC | Angers SCO | Arsenal | Atalanta | Athletic Club | Atlético Madrid | Augsburg | Barcelona | Bayern | Benevento | Bologna | Bordeaux | Brighton & Hove Albion | Burnley | Caen | Cagliari | Celta de Vigo | Chelsea | Chievo | Crotone | Crystal Palace | Deportivo Alavés | Deportivo La Coruña | Dijon | Dortmund | Eibar | Ein Frankfurt | Espanyol | Everton | Fiorentina | Freiburg | Genoa | Getafe | Girona | Guingamp | Hamburger | Hannover | Hellas Verona | Hertha | Hoffenheim | Huddersfield Town | Internazionale | Juventus | Köln | Las Palmas | Lazio | Leganés | Leicester City | Levante | Leverkusen | Lille | Liverpool | M’gladbach | Mainz | Málaga | Manchester United | Metz | Milan | Monaco | Montpellier | Nantes | Napoli | Newcastle United | Nice | Olympique Lyonnais | Olympique Marseille | PSG | RB Leipzig | Real Betis | Real Madrid | Real Sociedad | Rennes | Roma | Saint-Étienne | Sampdoria | Sassuolo | Schalke 04 | Sevilla | Southampton | SPAL | Stoke City | Strasbourg | Stuttgart | Swansea City | Torino | Tottenham Hotspur | Toulouse | Troyes | Udinese | Valencia | Villarreal | Watford | Werder Bremen | West Bromwich Albion | West Ham United | Wolfsburg | |
|---|---|---|---|---|---|---|---|---|---|---|---|---|---|---|---|---|---|---|---|---|---|---|---|---|---|---|---|---|---|---|---|---|---|---|---|---|---|---|---|---|---|---|---|---|---|---|---|---|---|---|---|---|---|---|---|---|---|---|---|---|---|---|---|---|---|---|---|---|---|---|---|---|---|---|---|---|---|---|---|---|---|---|---|---|---|---|---|---|---|---|---|---|---|---|---|---|---|---|
| Loss | -0.000239 | 7e-06 | 2.0e-06 | 1.0e-06 | 2.0e-05 | 8.0e-06 | 2e-06 | -1.1e-05 | 0.0e+00 | -3.0e-06 | -9e-06 | -1.2e-05 | -9.0e-06 | 2e-06 | 2.0e-06 | 4e-06 | 1.1e-05 | 4e-06 | 8e-06 | 8.0e-06 | 7.0e-06 | 9.0e-06 | 1.0e-05 | 1.4e-05 | -1.5e-05 | -2.0e-06 | 1.4e-05 | -4.0e-06 | 9.0e-06 | 2e-06 | 1e-06 | 7.0e-06 | -0.000001 | 1e-05 | -3.0e-06 | -6e-06 | 4.0e-06 | -1.0e-06 | -1.2e-05 | -2.2e-05 | 7.0e-06 | 1.5e-05 | 4e-06 | 7e-06 | 5.4e-05 | 1.0e-06 | 4.6e-05 | 5.0e-06 | 2e-06 | 3e-06 | 8e-06 | 1.3e-05 | 5e-06 | -3e-06 | 1.1e-05 | -7.0e-06 | -1.3e-05 | 7.0e-06 | -7e-06 | 8.0e-06 | -1.2e-05 | -8.0e-06 | -3.0e-06 | -3.0e-06 | 3e-06 | -1.9e-05 | 3.0e-06 | 1.2e-05 | -8.3e-05 | 8e-06 | 1e-06 | 7e-06 | -1.0e-05 | -1.7e-05 | 4e-06 | 3.0e-06 | 1.5e-05 | -1.1e-05 | 6.0e-06 | 7e-06 | -5e-06 | 4e-06 | -2.0e-06 | 3e-06 | 8.0e-06 | 2.5e-05 | 5.0e-06 | 2.5e-05 | 1.4e-05 | -1.7e-05 | 5.3e-05 | -1.1e-05 | 2.3e-05 | 9e-06 | 4.0e-06 | 3.5e-05 | 9e-06 | -2e-06 |
| Draw | 0.000074 | 0e+00 | 1.5e-05 | -1.8e-05 | 2.7e-05 | 1.8e-05 | -6e-06 | 9.0e-06 | -1.5e-05 | 3.4e-05 | 6e-06 | -2.0e-06 | -1.6e-05 | 2e-06 | 4.8e-05 | -1e-06 | 1.0e-06 | 2e-06 | 0e+00 | 1.5e-05 | 3.3e-05 | -1.4e-05 | 1.5e-05 | 7.0e-06 | -8.0e-06 | -1.2e-05 | 1.7e-05 | -1.5e-05 | 1.1e-05 | 4e-06 | -2e-06 | 2.8e-05 | -0.000102 | 6e-06 | -1.2e-05 | -9e-06 | -2.6e-05 | -2.3e-05 | -1.8e-05 | 7.0e-06 | -2.3e-05 | 1.0e-06 | -9e-06 | 4e-06 | -5.0e-06 | 1.4e-05 | 2.1e-05 | 1.2e-05 | 3e-06 | -1e-05 | -2e-05 | 4.5e-05 | 2e-06 | 5e-06 | 2.1e-05 | -1.1e-05 | 0.0e+00 | -2.4e-05 | -8e-06 | 2.1e-05 | 1.0e-05 | 6.2e-05 | -1.4e-05 | -2.5e-05 | 0e+00 | -2.3e-05 | -1.5e-05 | -1.0e-06 | 3.6e-05 | 6e-06 | -4e-06 | 8e-06 | -1.3e-05 | -3.8e-05 | 5e-06 | -2.1e-05 | 2.1e-05 | -2.0e-06 | -1.5e-05 | -1e-05 | -2e-06 | 6e-06 | -2.6e-05 | 9e-06 | 1.5e-05 | 2.3e-05 | 1.4e-05 | -3.5e-05 | 1.0e-06 | -1.9e-05 | 2.2e-05 | -3.4e-05 | 3.2e-05 | 2e-06 | 3.3e-05 | -6.1e-05 | 4e-06 | 6e-06 |
| Win | -0.000239 | 7e-06 | 2.0e-06 | 1.0e-06 | 2.0e-05 | 8.0e-06 | 2e-06 | -1.1e-05 | 0.0e+00 | -3.0e-06 | -9e-06 | -1.2e-05 | -9.0e-06 | 2e-06 | 2.0e-06 | 4e-06 | 1.1e-05 | 4e-06 | 8e-06 | 8.0e-06 | 7.0e-06 | 9.0e-06 | 1.0e-05 | 1.4e-05 | -1.5e-05 | -2.0e-06 | 1.4e-05 | -4.0e-06 | 9.0e-06 | 2e-06 | 1e-06 | 7.0e-06 | -0.000001 | 1e-05 | -3.0e-06 | -6e-06 | 4.0e-06 | -1.0e-06 | -1.2e-05 | -2.2e-05 | 7.0e-06 | 1.5e-05 | 4e-06 | 7e-06 | 5.4e-05 | 1.0e-06 | 4.6e-05 | 5.0e-06 | 2e-06 | 3e-06 | 8e-06 | 1.3e-05 | 5e-06 | -3e-06 | 1.1e-05 | -7.0e-06 | -1.3e-05 | 7.0e-06 | -7e-06 | 8.0e-06 | -1.2e-05 | -8.0e-06 | -3.0e-06 | -3.0e-06 | 3e-06 | -1.9e-05 | 3.0e-06 | 1.2e-05 | -8.3e-05 | 8e-06 | 1e-06 | 7e-06 | -1.0e-05 | -1.7e-05 | 4e-06 | 3.0e-06 | 1.5e-05 | -1.1e-05 | 6.0e-06 | 7e-06 | -5e-06 | 4e-06 | -2.0e-06 | 3e-06 | 8.0e-06 | 2.5e-05 | 5.0e-06 | 2.5e-05 | 1.4e-05 | -1.7e-05 | 5.3e-05 | -1.1e-05 | 2.3e-05 | 9e-06 | 4.0e-06 | 3.5e-05 | 9e-06 | -2e-06 |